
Every year around this time, buyers and sellers start asking the same question: what is the market actually doing? Not what they heard at a dinner party, not what a headline said — what do the real numbers show? For anyone buying, selling, or investing in Topeka real estate, 2025 delivered a clear answer. The market moved. Prices climbed. Properties sold fast. And for investors in particular, the window on certain opportunities is narrowing in ways that have real consequences for what you do next.
2025 vs. 2024 — The Key Numbers
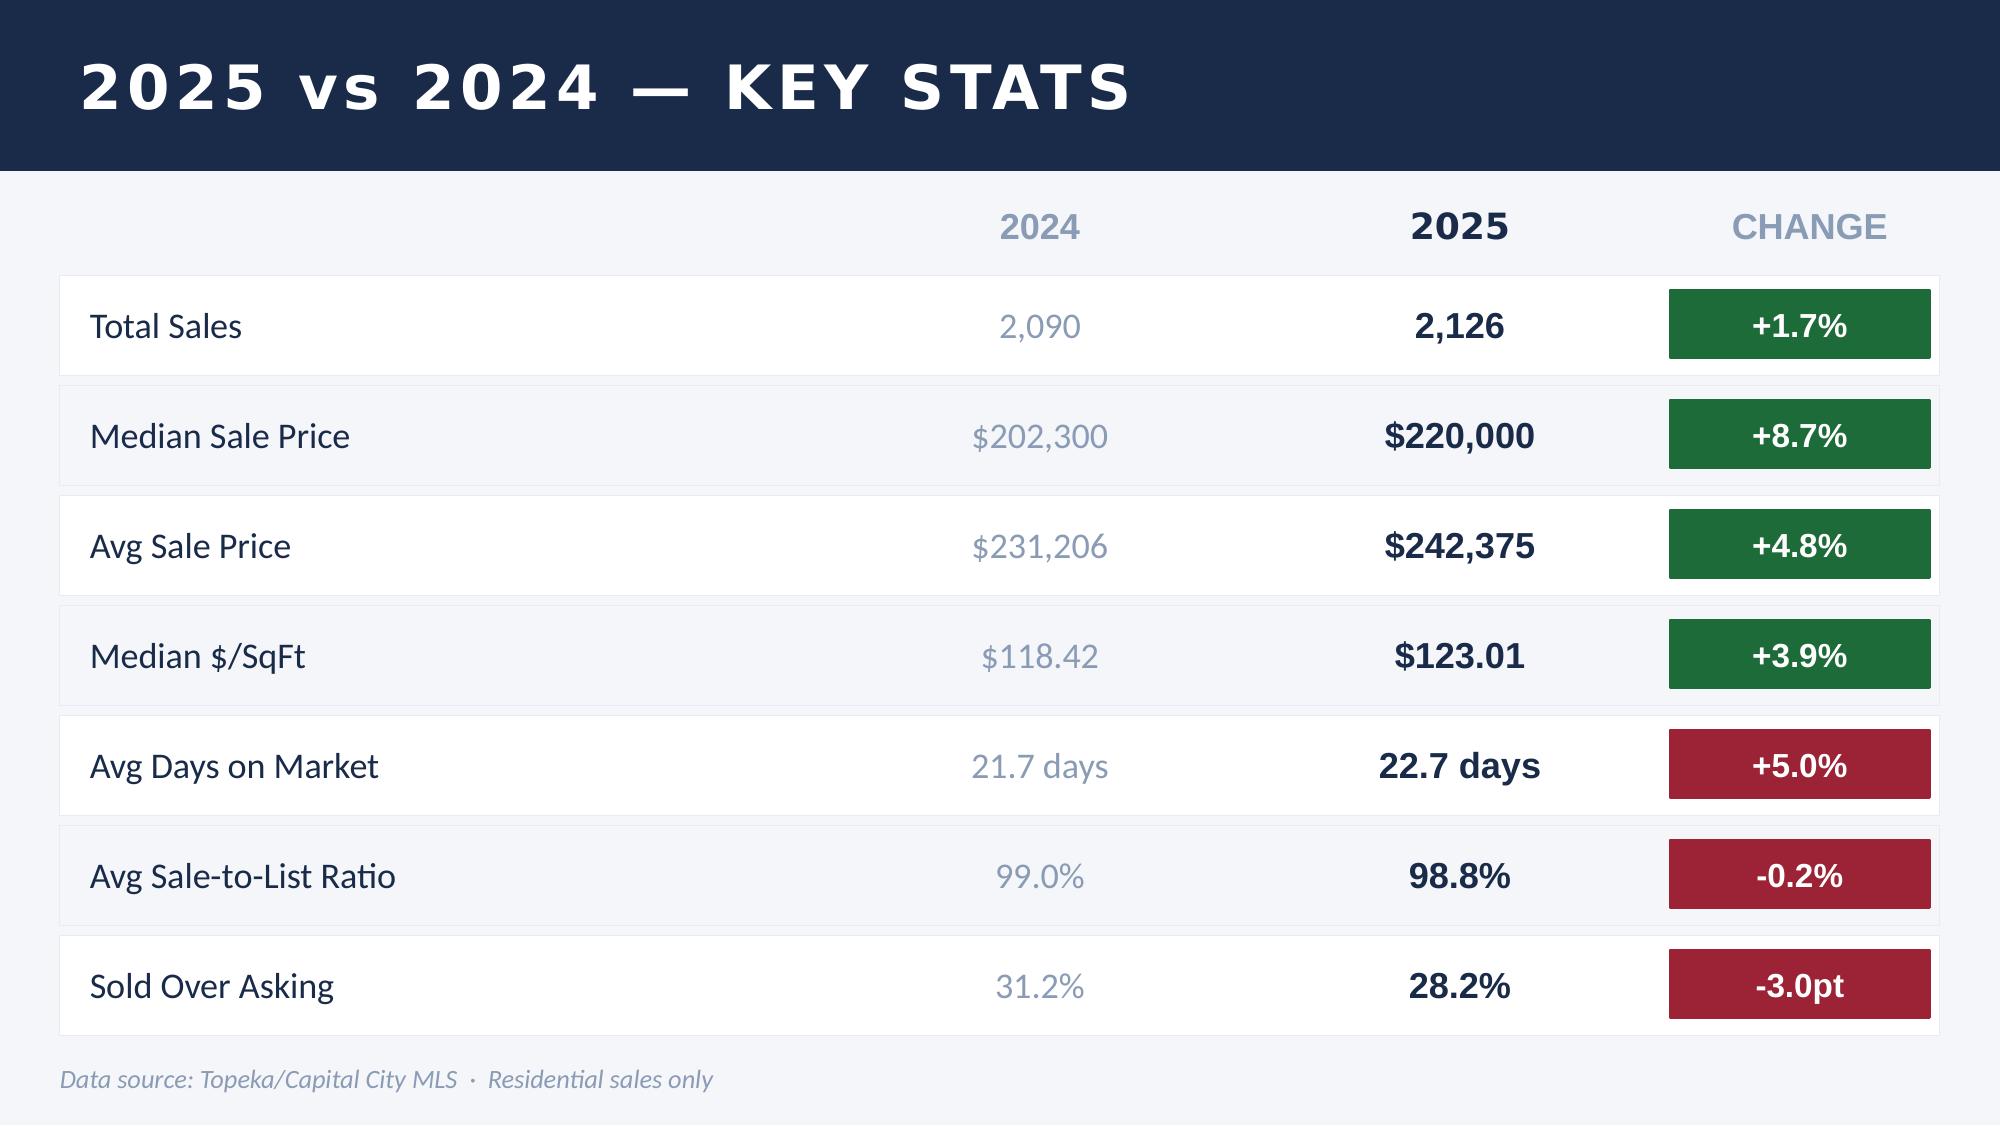
When you stack 2025 against 2024, the story is one of continued momentum. Total sales came in at 2,126 — up 1.7% from the 2,090 recorded the year before. The price movement is where the story really unfolds.
| $220K Median Sale Price +8.7% YoY |
$242K Avg Sale Price +4.8% YoY |
| $123 Median $/SqFt +3.9% YoY |
2,126 Total Sales +1.7% YoY |
Across every price measure, 2025 showed consistent, broad-based appreciation — not a spike in one segment, but steady upward movement across the board. Average days on market ticked up slightly from 21.7 to 22.7 days, and the percentage of homes sold over asking dipped from 31.2% to 28.2%. Those small shifts suggest the market eased just a bit from 2024's intense competitive pressure — but this is still firmly a seller's market.
Monthly Sales Volume
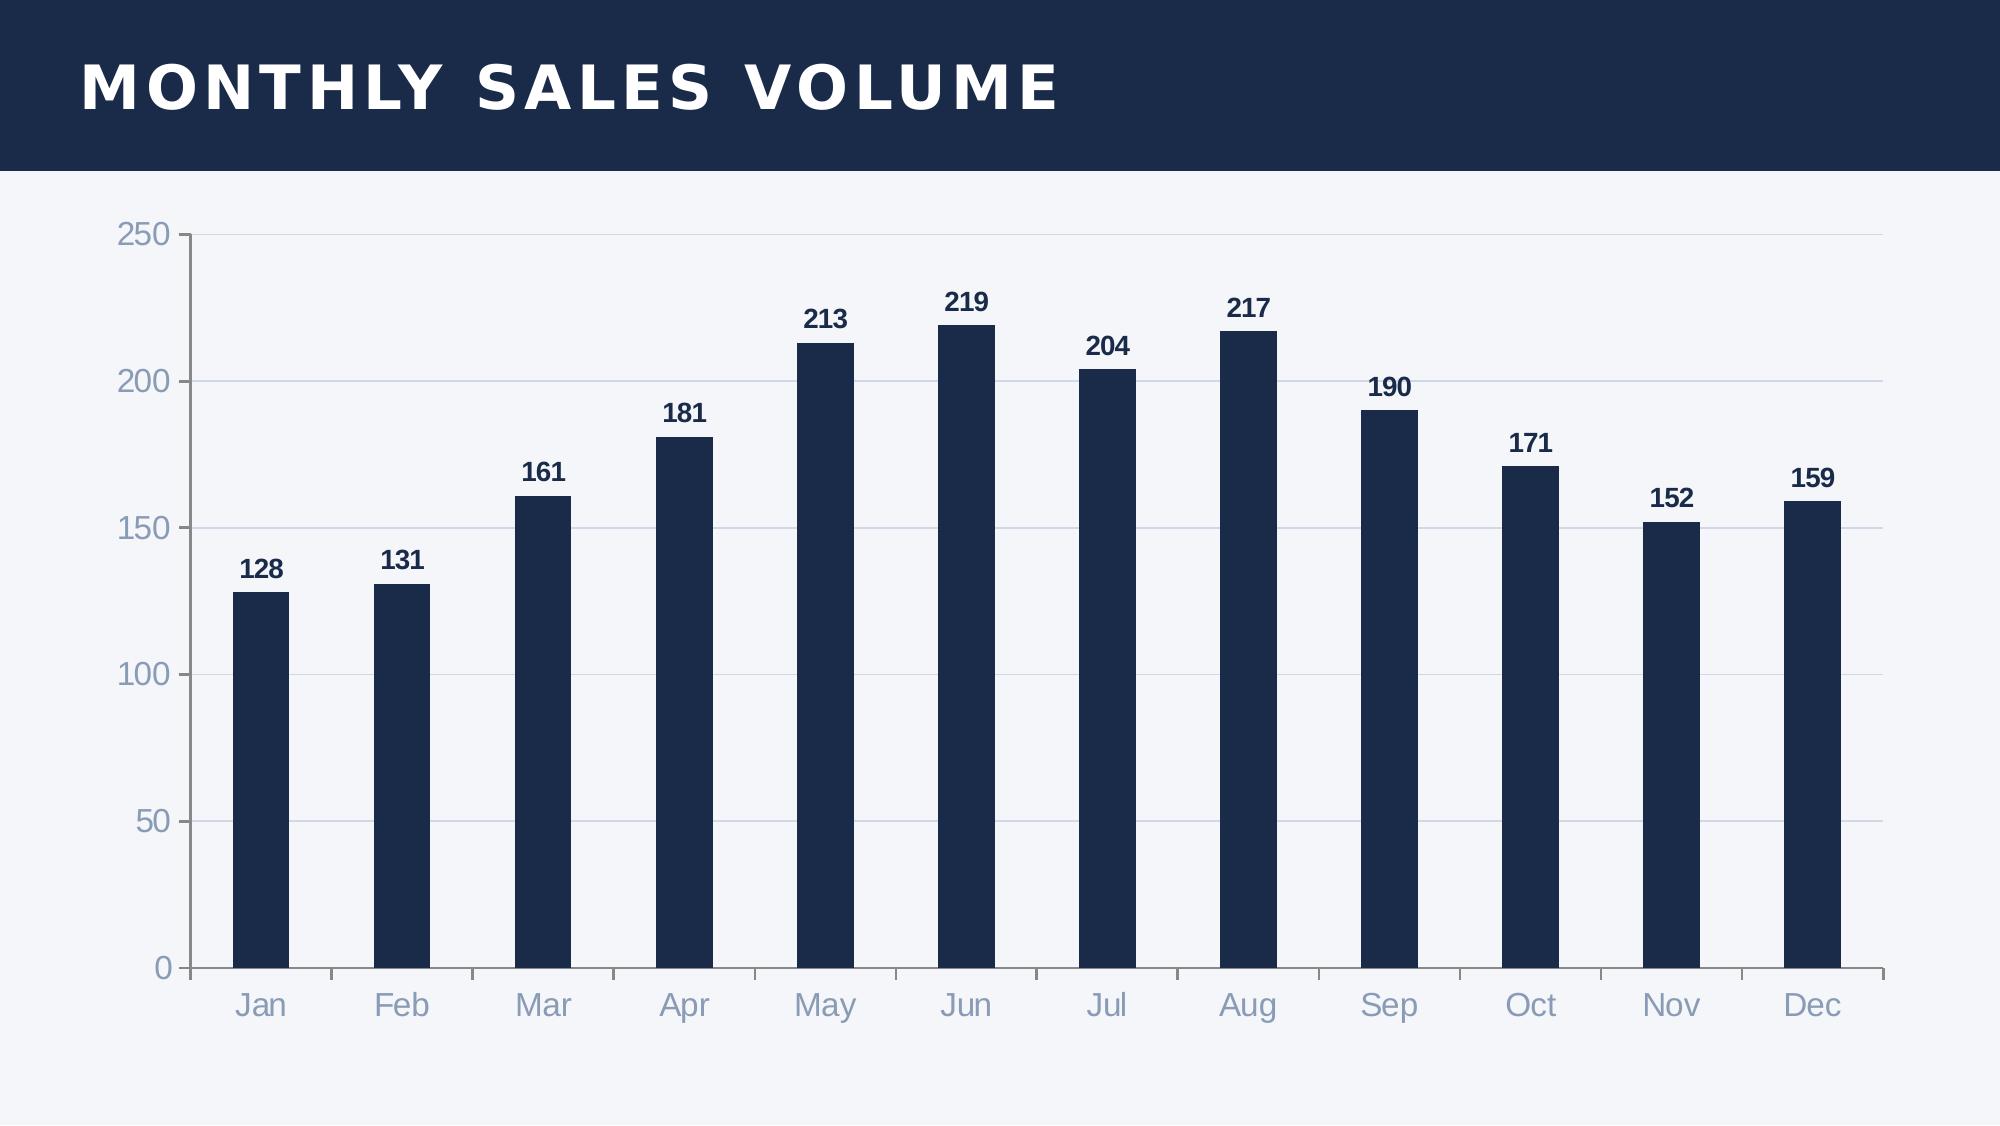
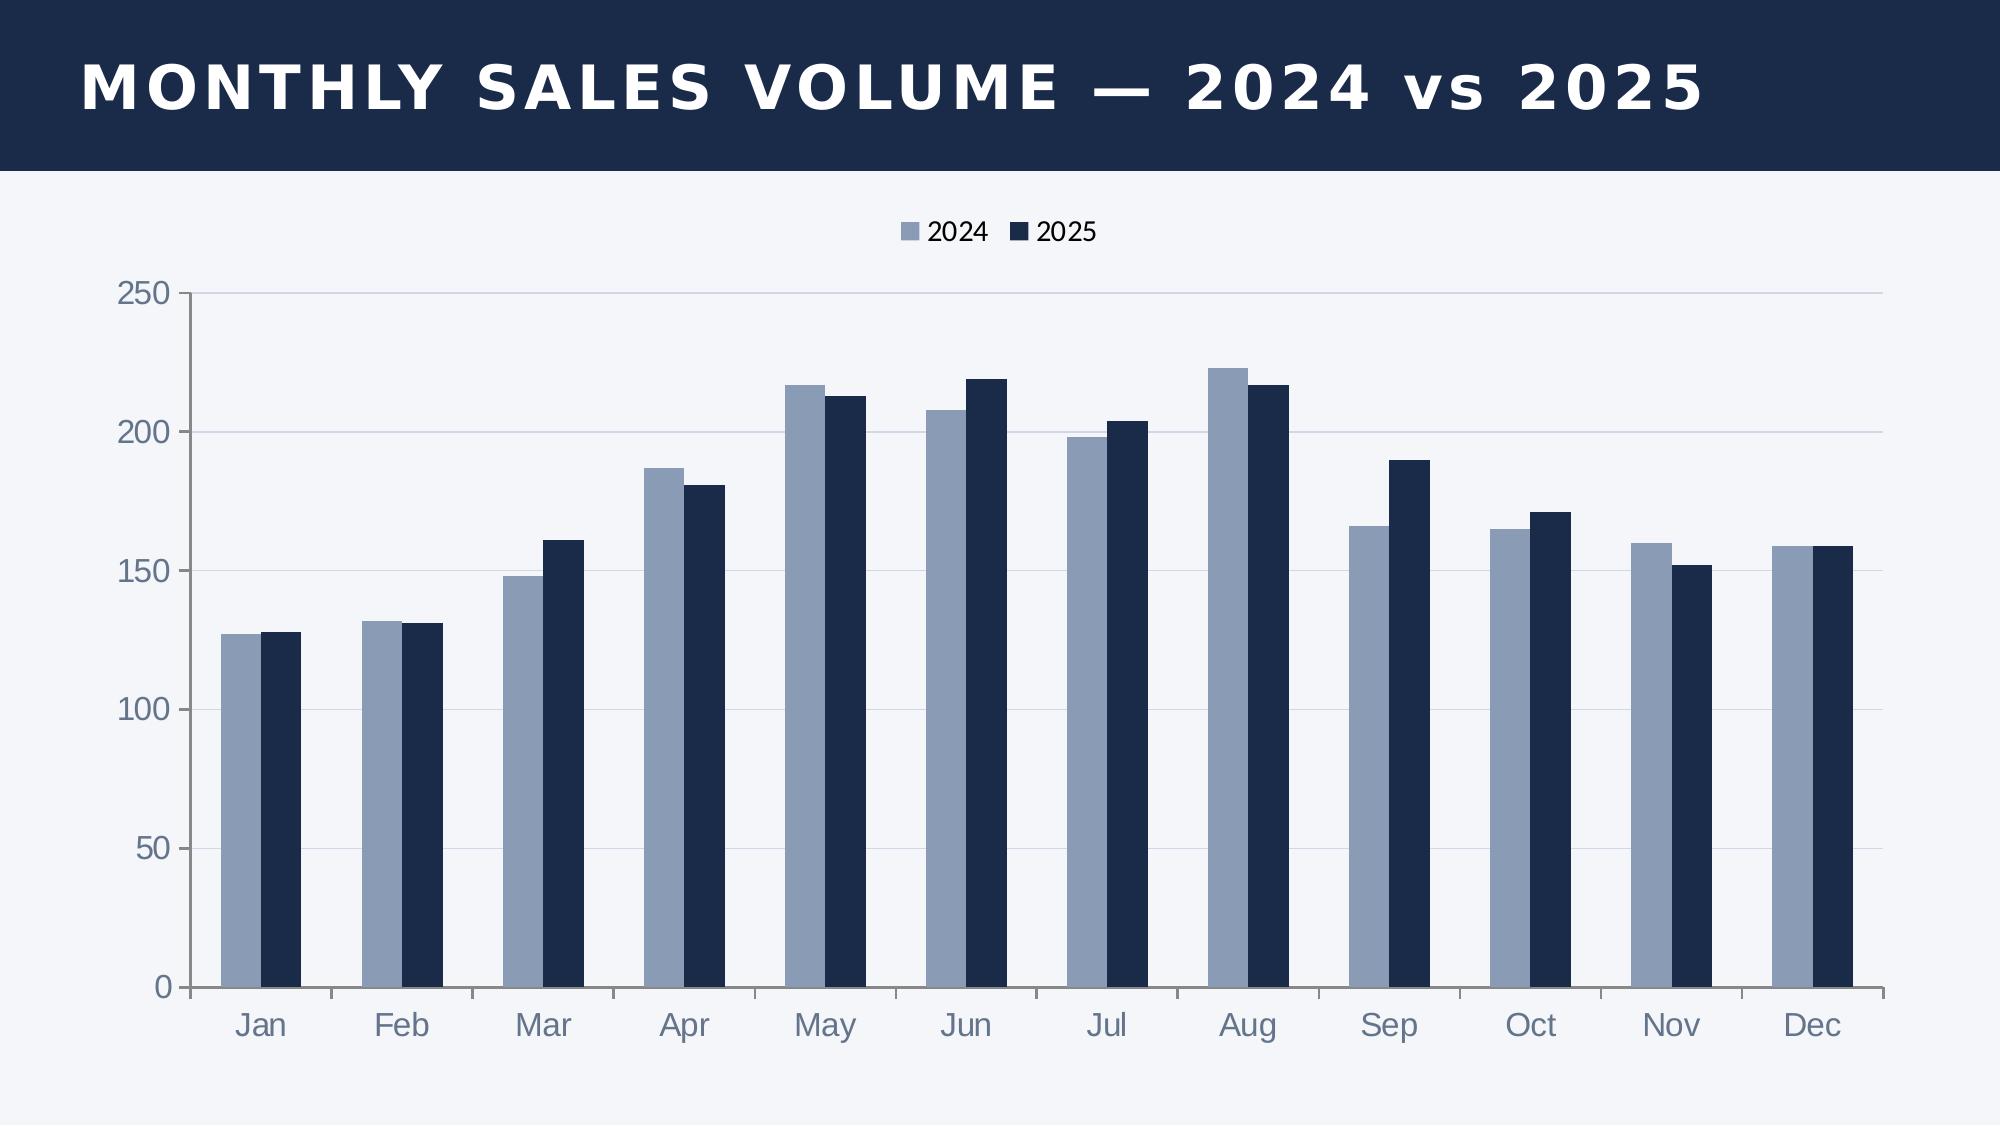
Q1 is historically the slowest quarter — in 2025 it produced around 420 sales while summer months hit 611–613. That seasonal gap creates a window right now where motivated sellers are present, active buyer competition is lower than it will be in spring, and buyers with financing in place have more leverage than they will in May or June.
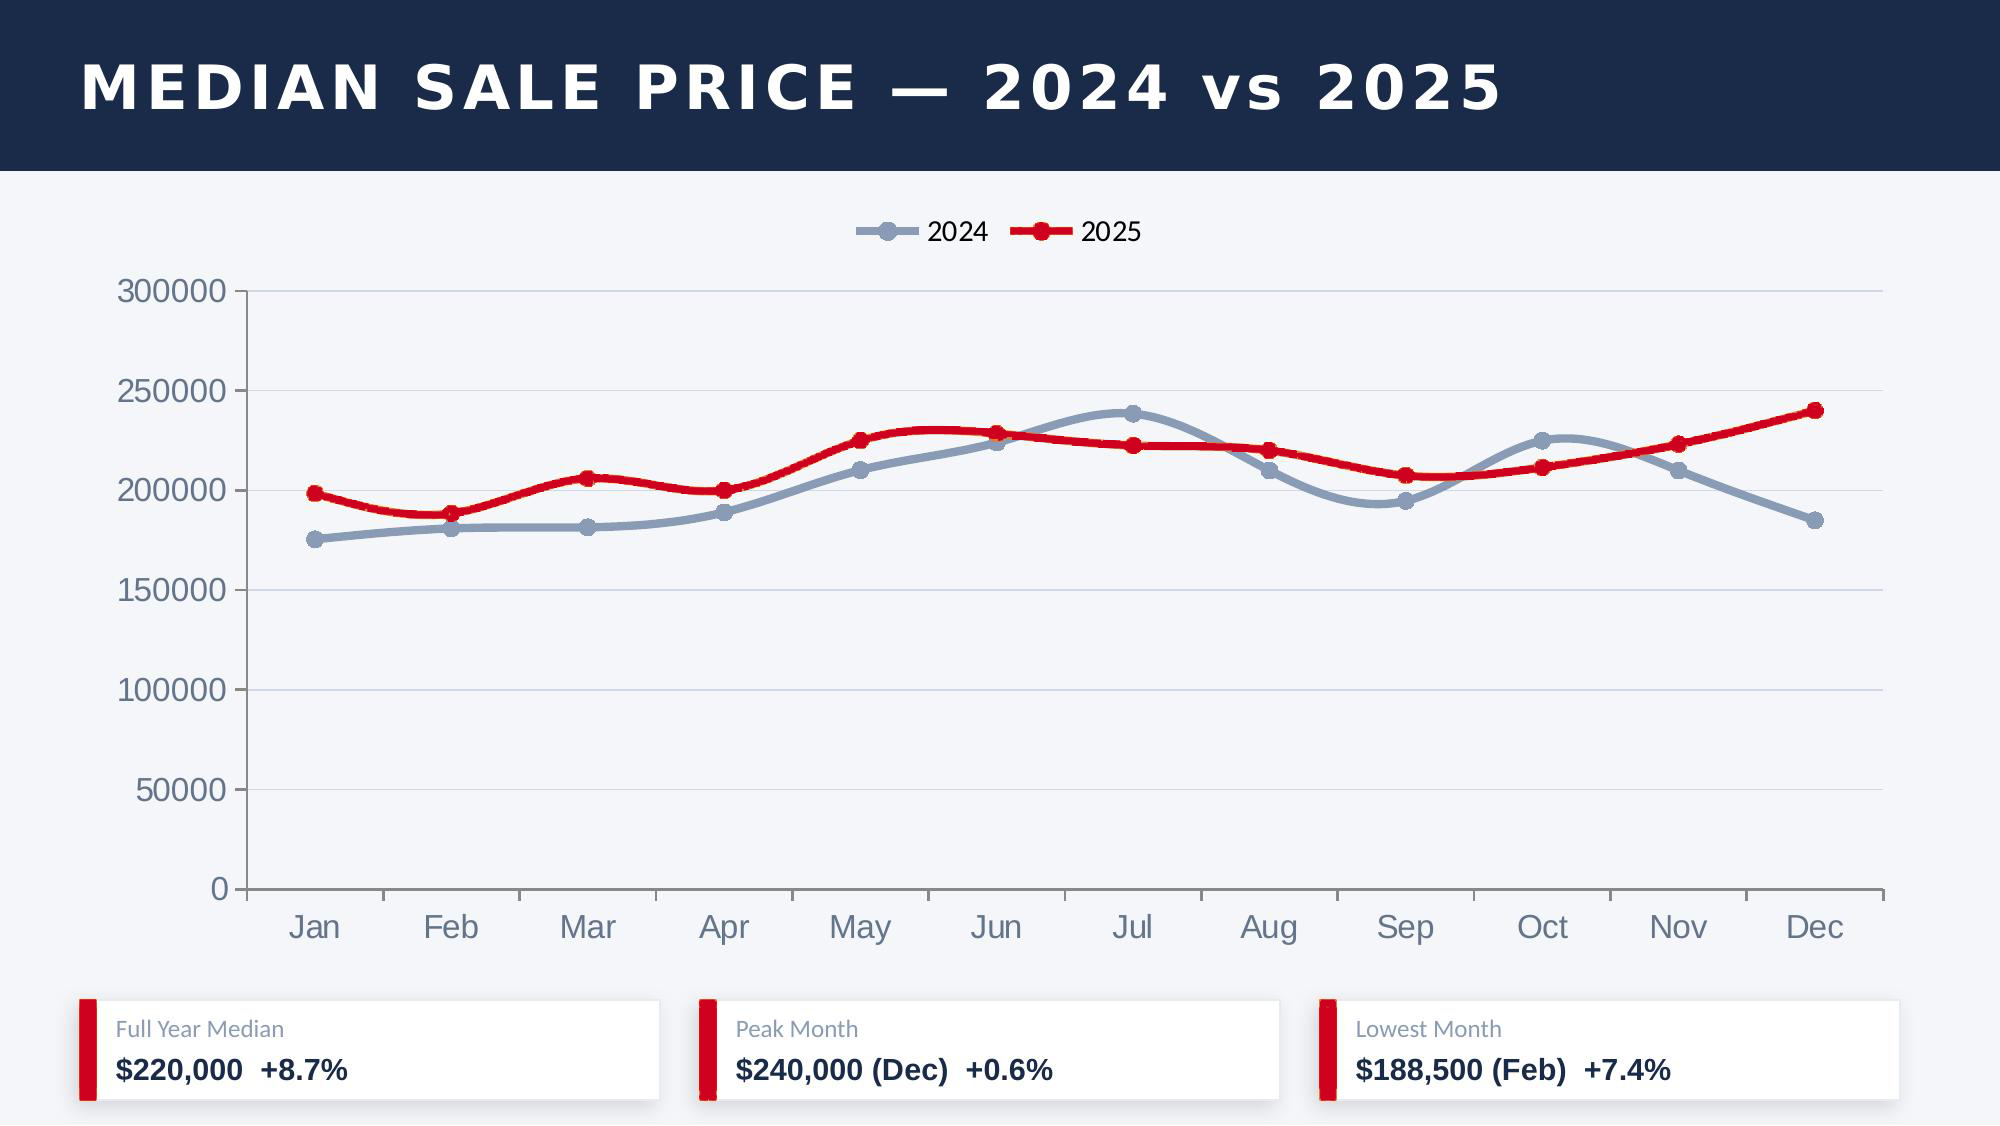
Median Sale Price — 2024 vs. 2025
The line chart tells the story: 2025 ran above 2024 pricing for virtually the entire year. December closed at a $240,000 median — the highest month of the year — giving the market positive momentum heading into 2026.
Where Properties Are Selling
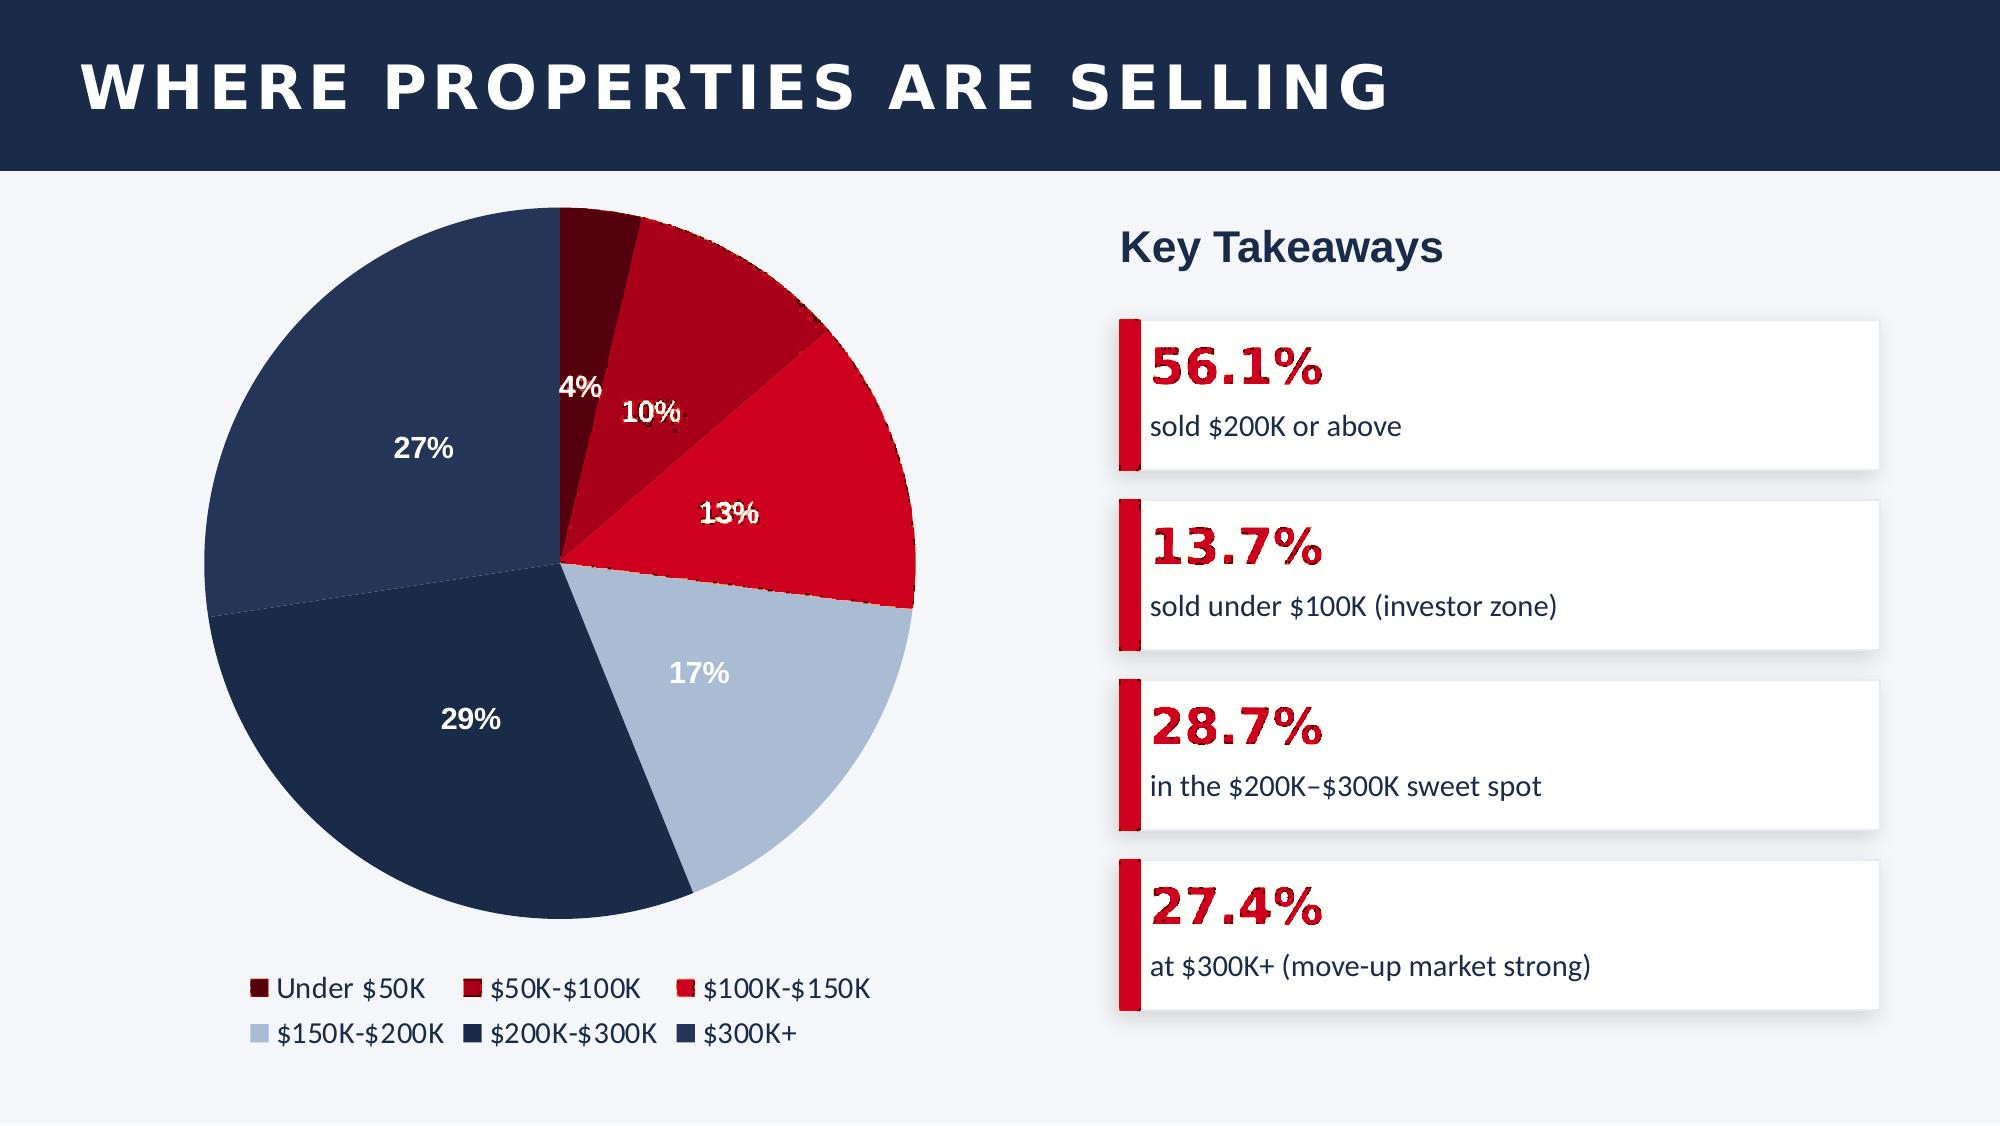
Just over 56% of all sales closed at $200,000 or above. The $200K–$300K range was the sweet spot for volume at 28.7% of all transactions. The $300K-and-above segment represented 27.4%, showing the move-up market is healthy and active. On the other end, 13.7% of sales came in under $100,000 — the segment that real estate investors have traditionally targeted for buy-and-hold strategies.
How Fast Is the Market Moving?
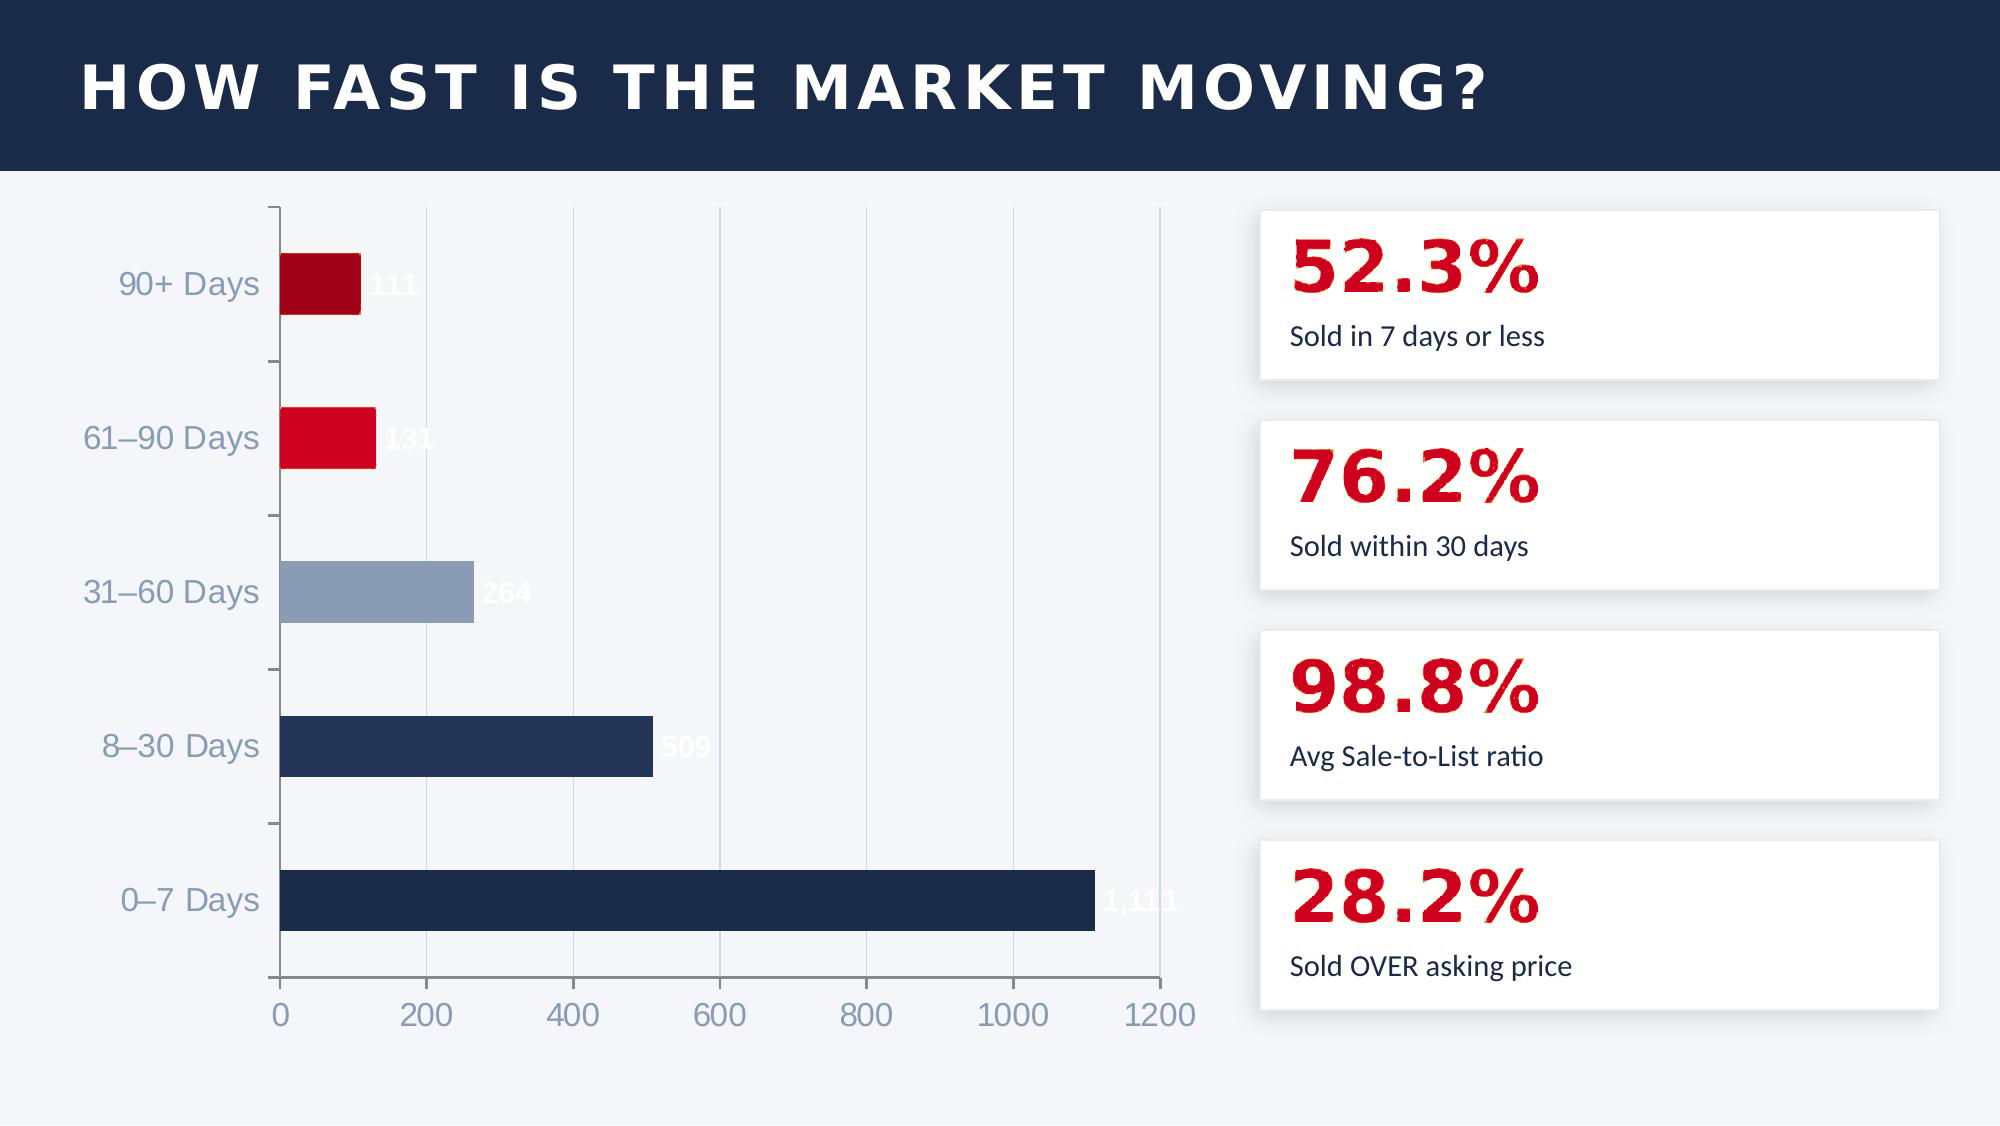
In 2025, 52.3% of all homes sold within 7 days or less. Three out of four homes — 76.2% — sold within 30 days. The average sale-to-list ratio held at 98.8%, meaning sellers are getting almost exactly what they ask.
This matters enormously for how buyers need to approach the market. If you are waiting to get pre-approved, if you are still deciding on your price range, if you need two weeks to think it over — you will watch deals disappear. Preparation is not just a good idea here. It is the actual competitive advantage.
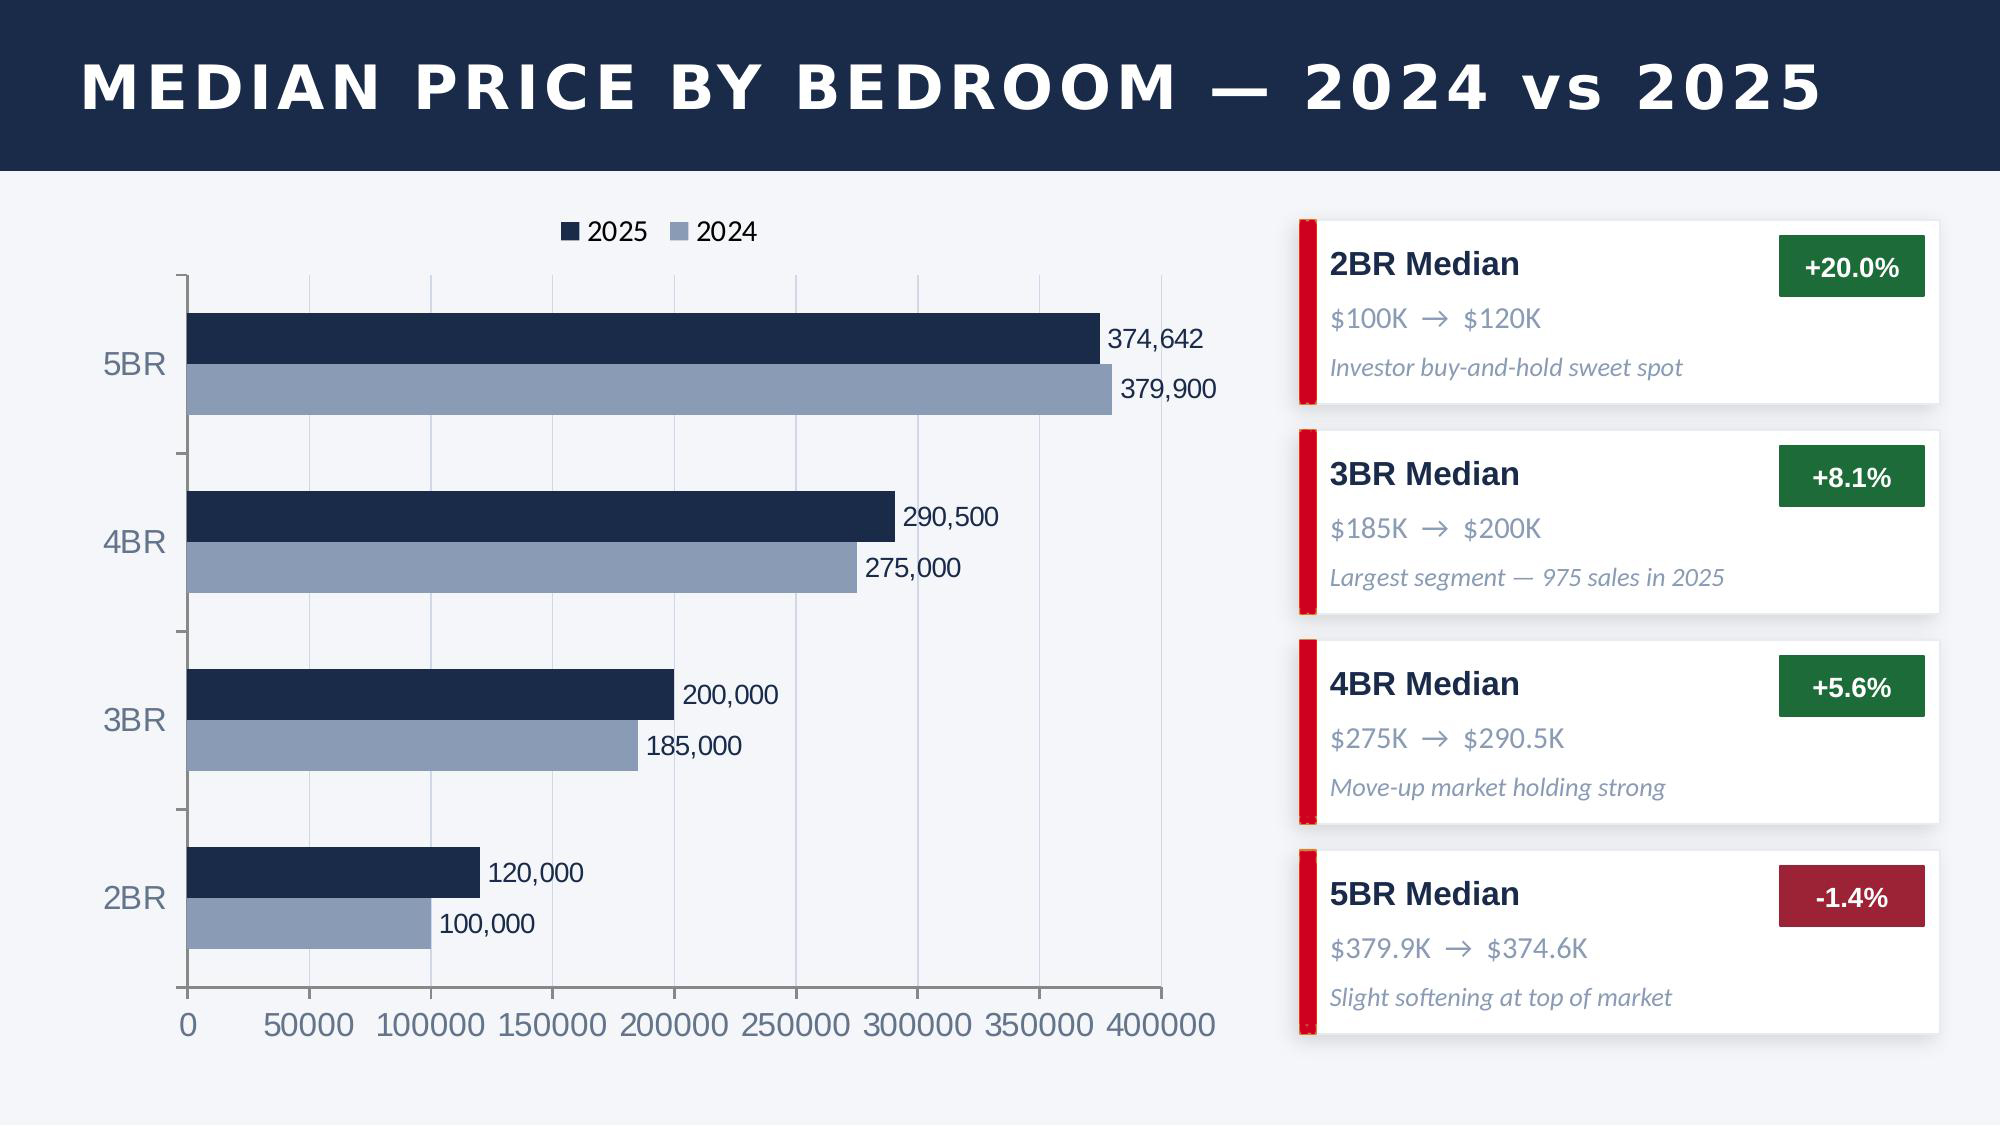
Median Price by Bedroom Count
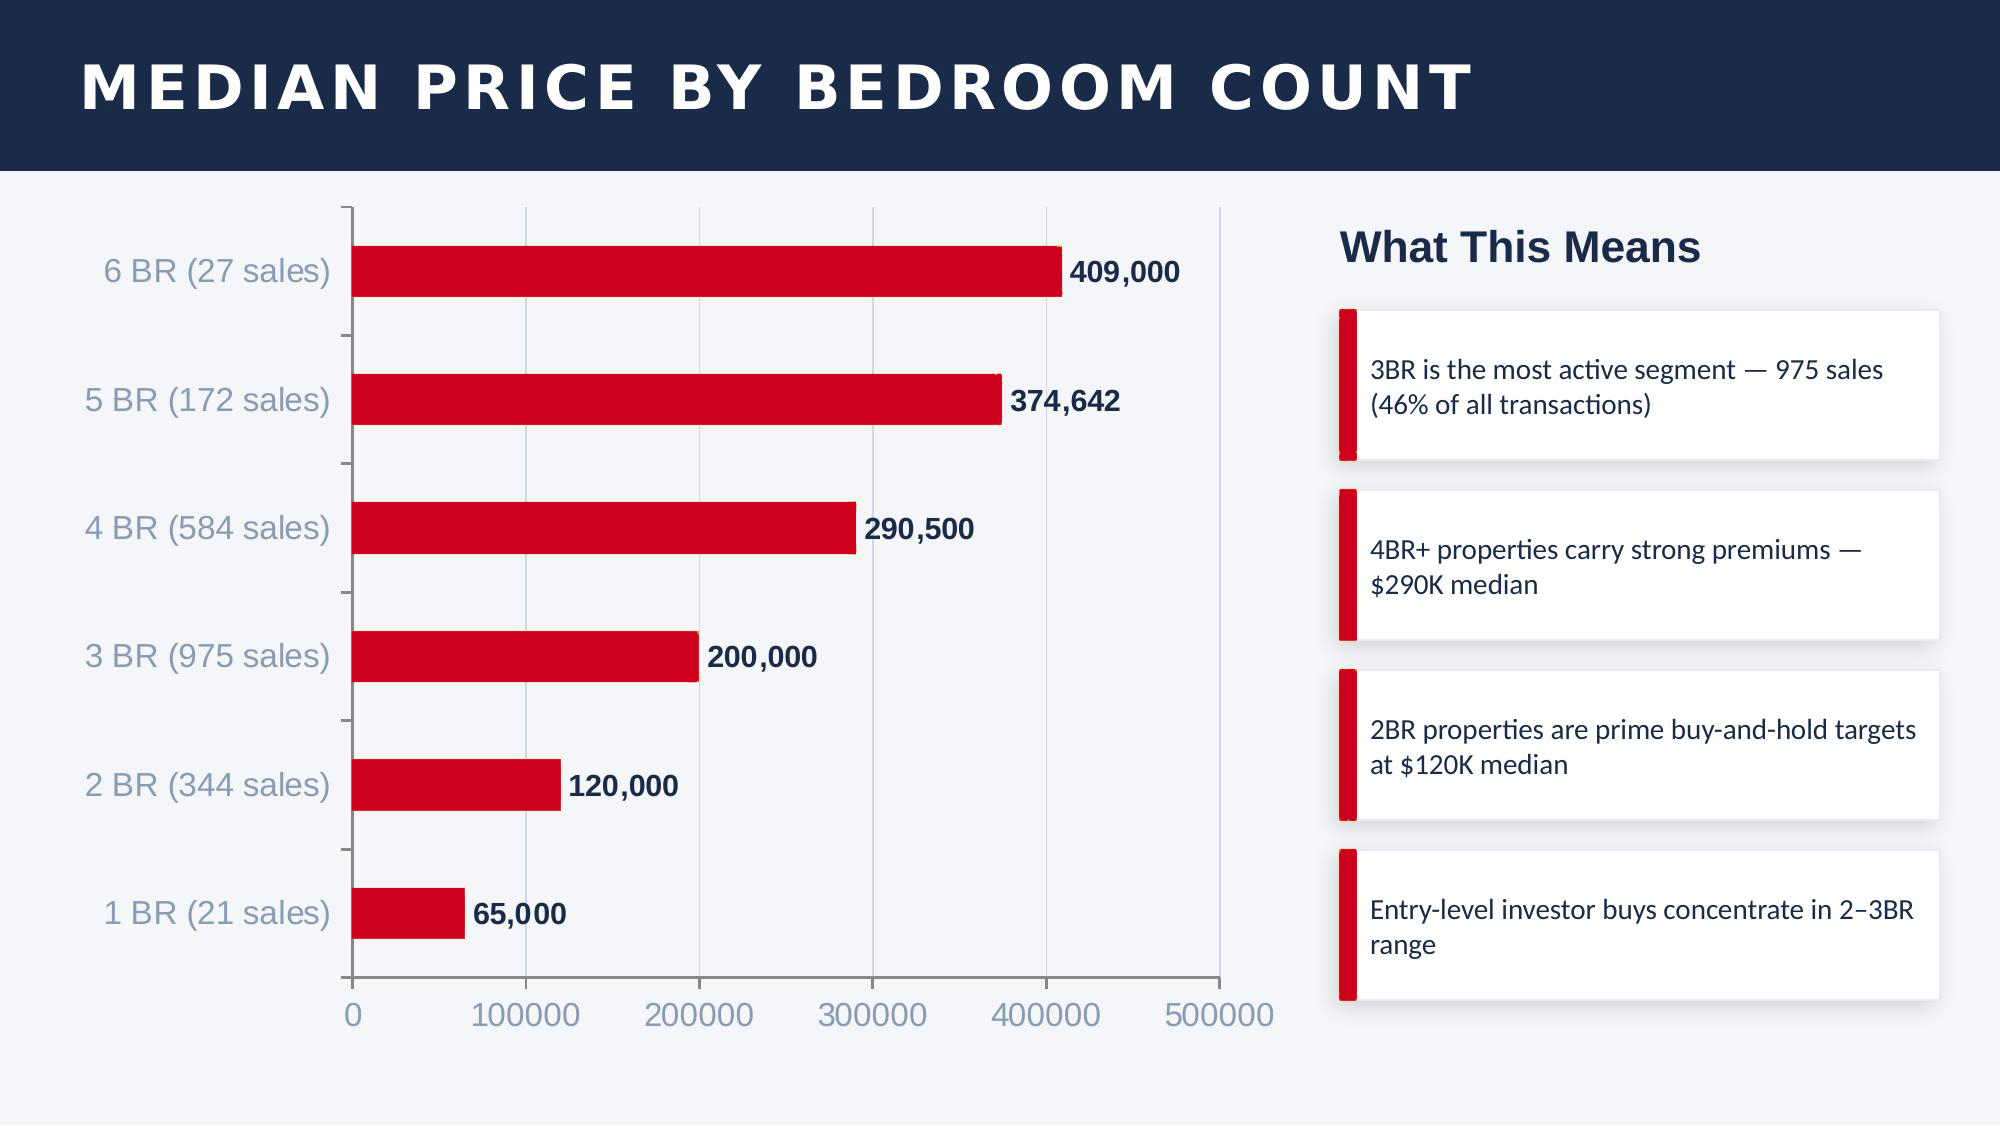
Three-bedroom homes dominated 2025 activity — 975 sales, representing 46% of all transactions. The median price for a 3BR came in at $200,000, up 8.1% from $185,000 in 2024. For investors, the two-bedroom segment is the one to watch: the median 2BR price jumped 20% year-over-year, from $100,000 to $120,000. That is the fastest-appreciating segment in the market.
The Investor Segment
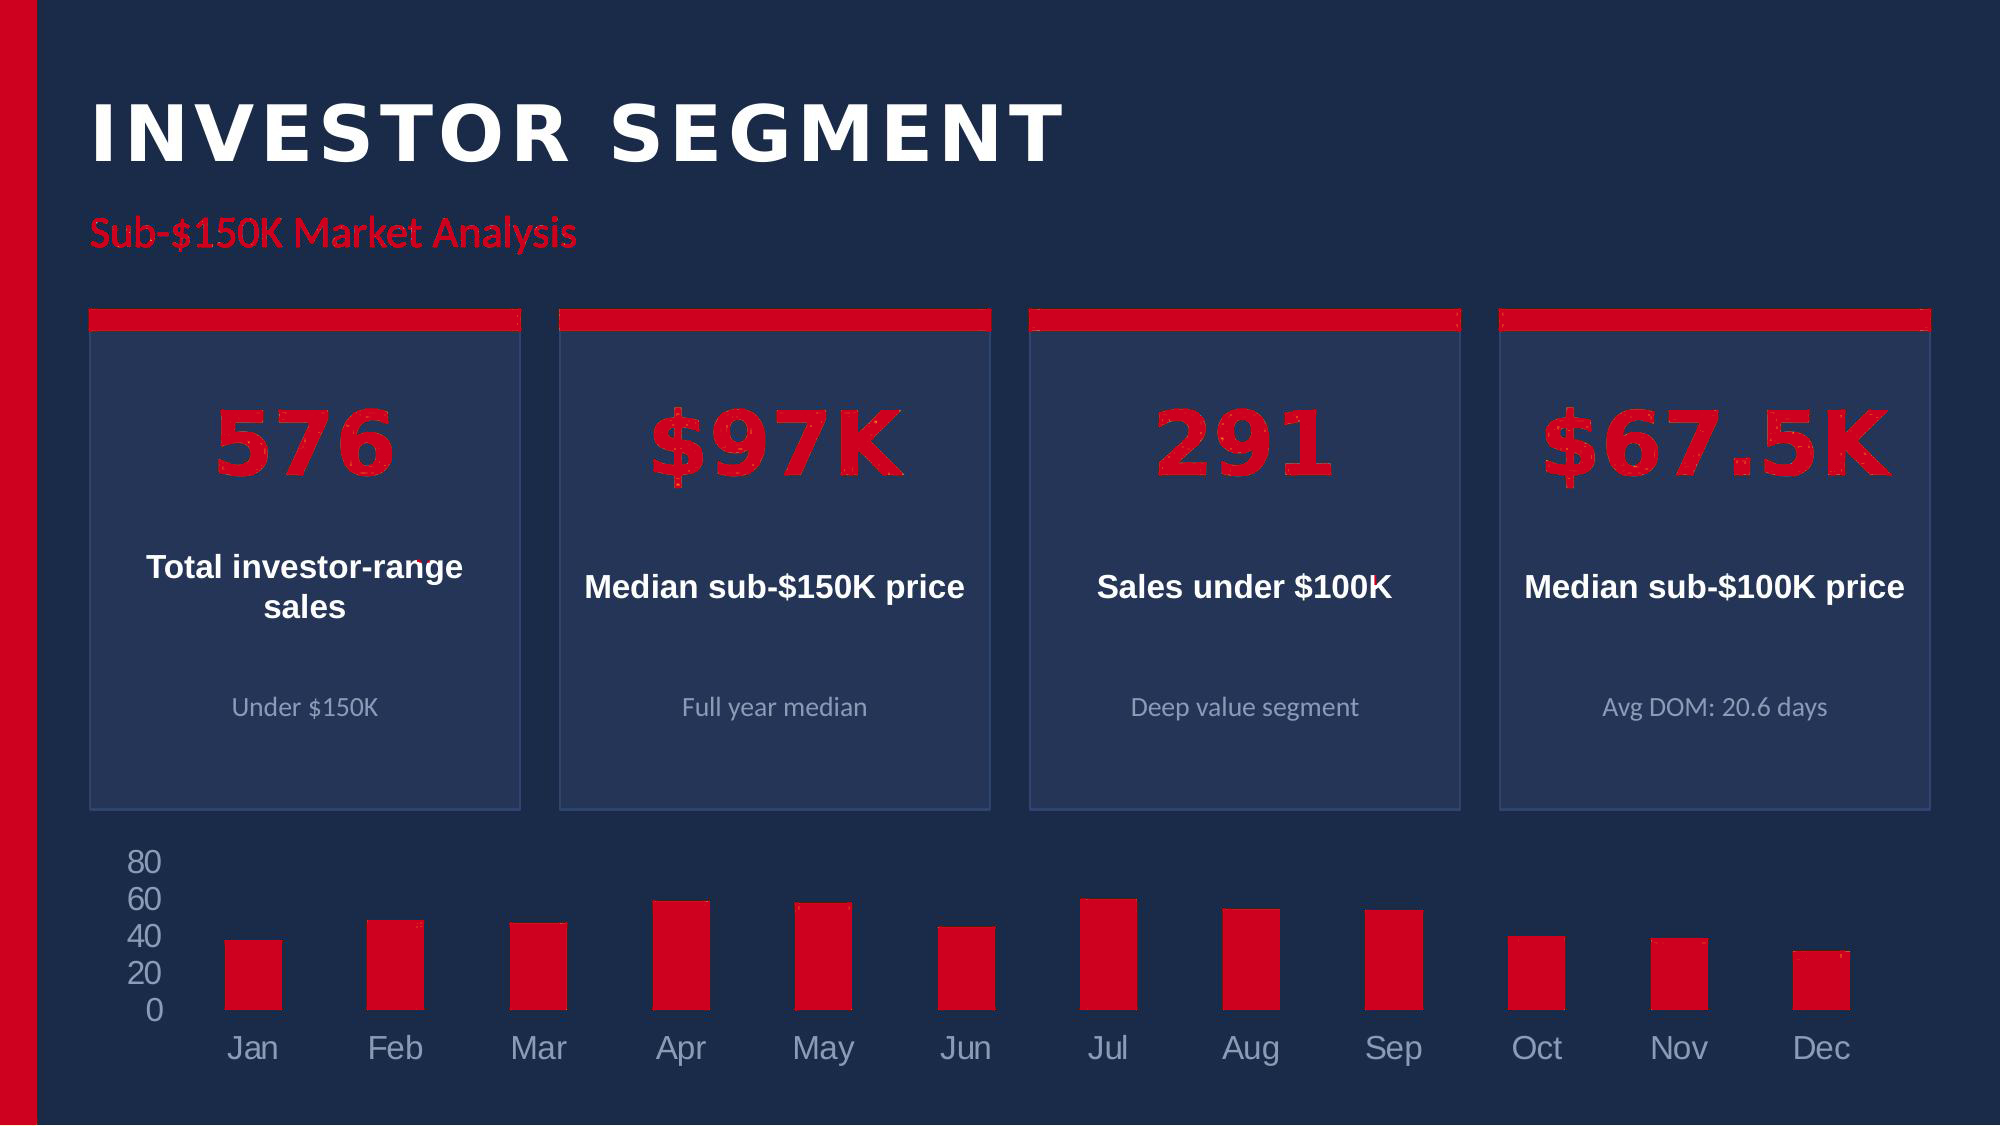
| 576 Investor-range Sales (Sub-$150K) |
$97K Median Sub-$150K Price |
| 291 Closings Under $100K |
20.6 Avg Days on Market Sub-$100K |
The deep value segment moves fast — faster, in some cases, than the broader market. Sub-$100K properties averaged just 20.6 days on market. If you are looking for a distressed property to rehab and hold, you do not have weeks to make a decision. The supply exists, but it is not sitting there waiting.
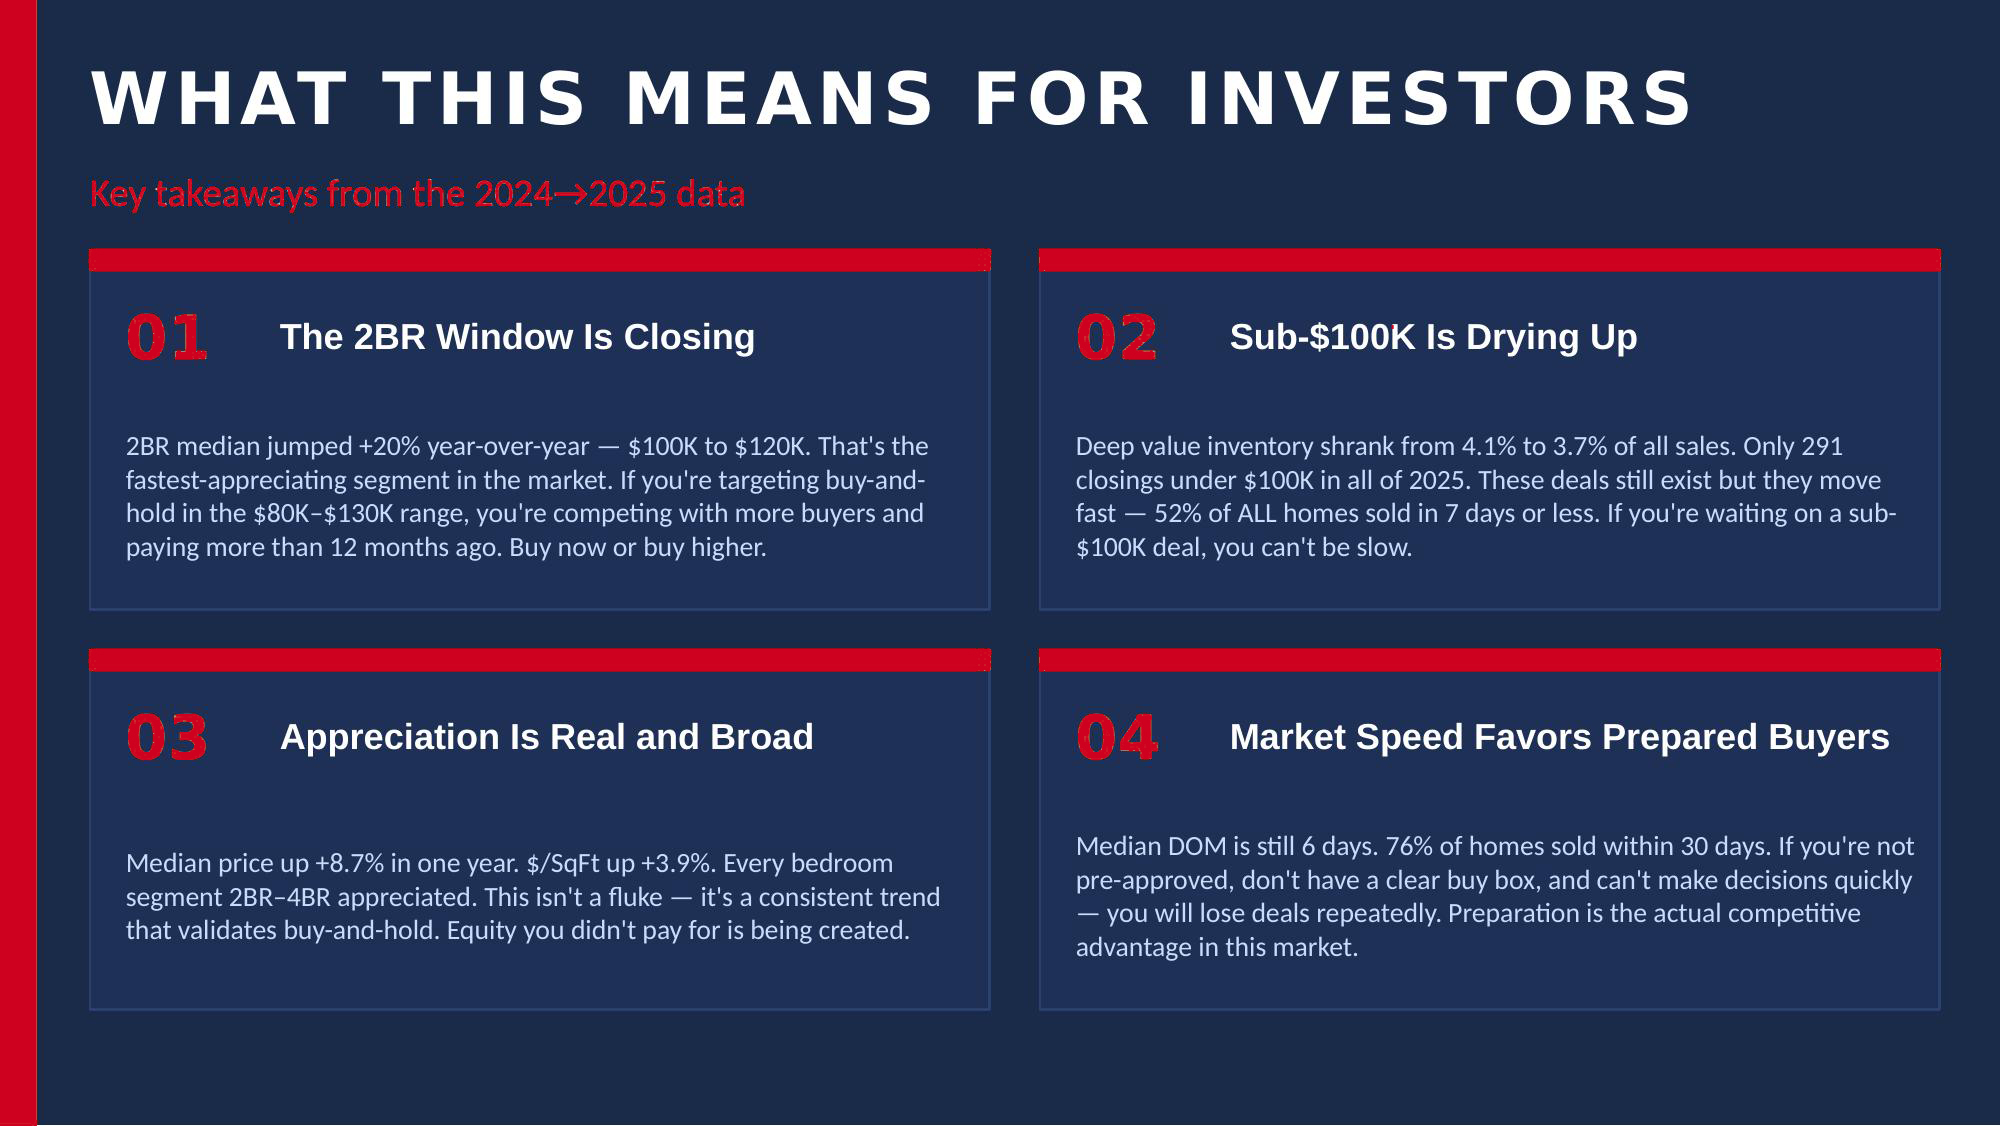
What the 2024→2025 Data Means for Investors
The Numbers Behind the Strategy
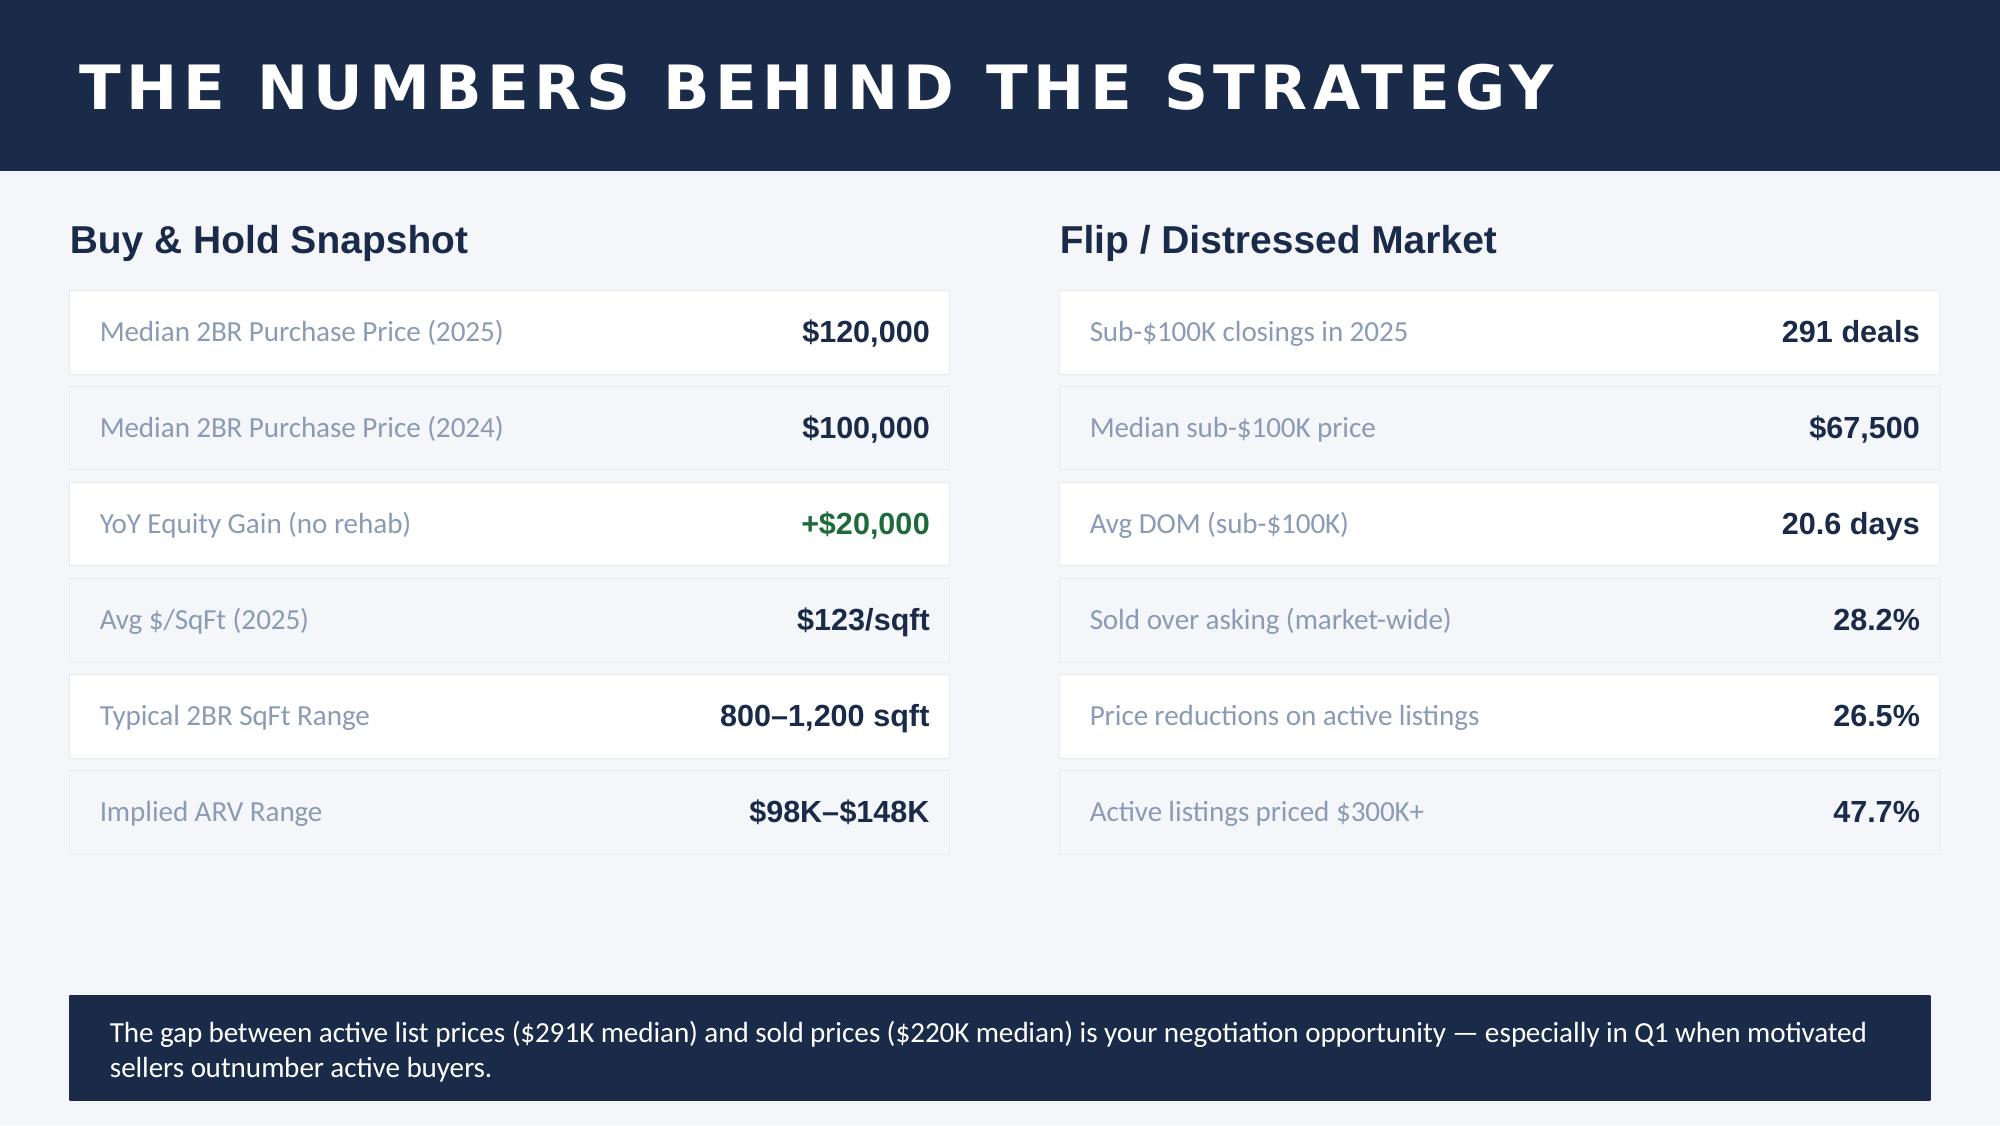
The gap between active list prices ($291K median) and sold prices ($220K median) is your negotiation opportunity — especially in Q1 when motivated sellers outnumber active buyers. For buy-and-hold investors, a 2BR buyer saw a $20,000 equity gain in 2025 without doing a single repair.
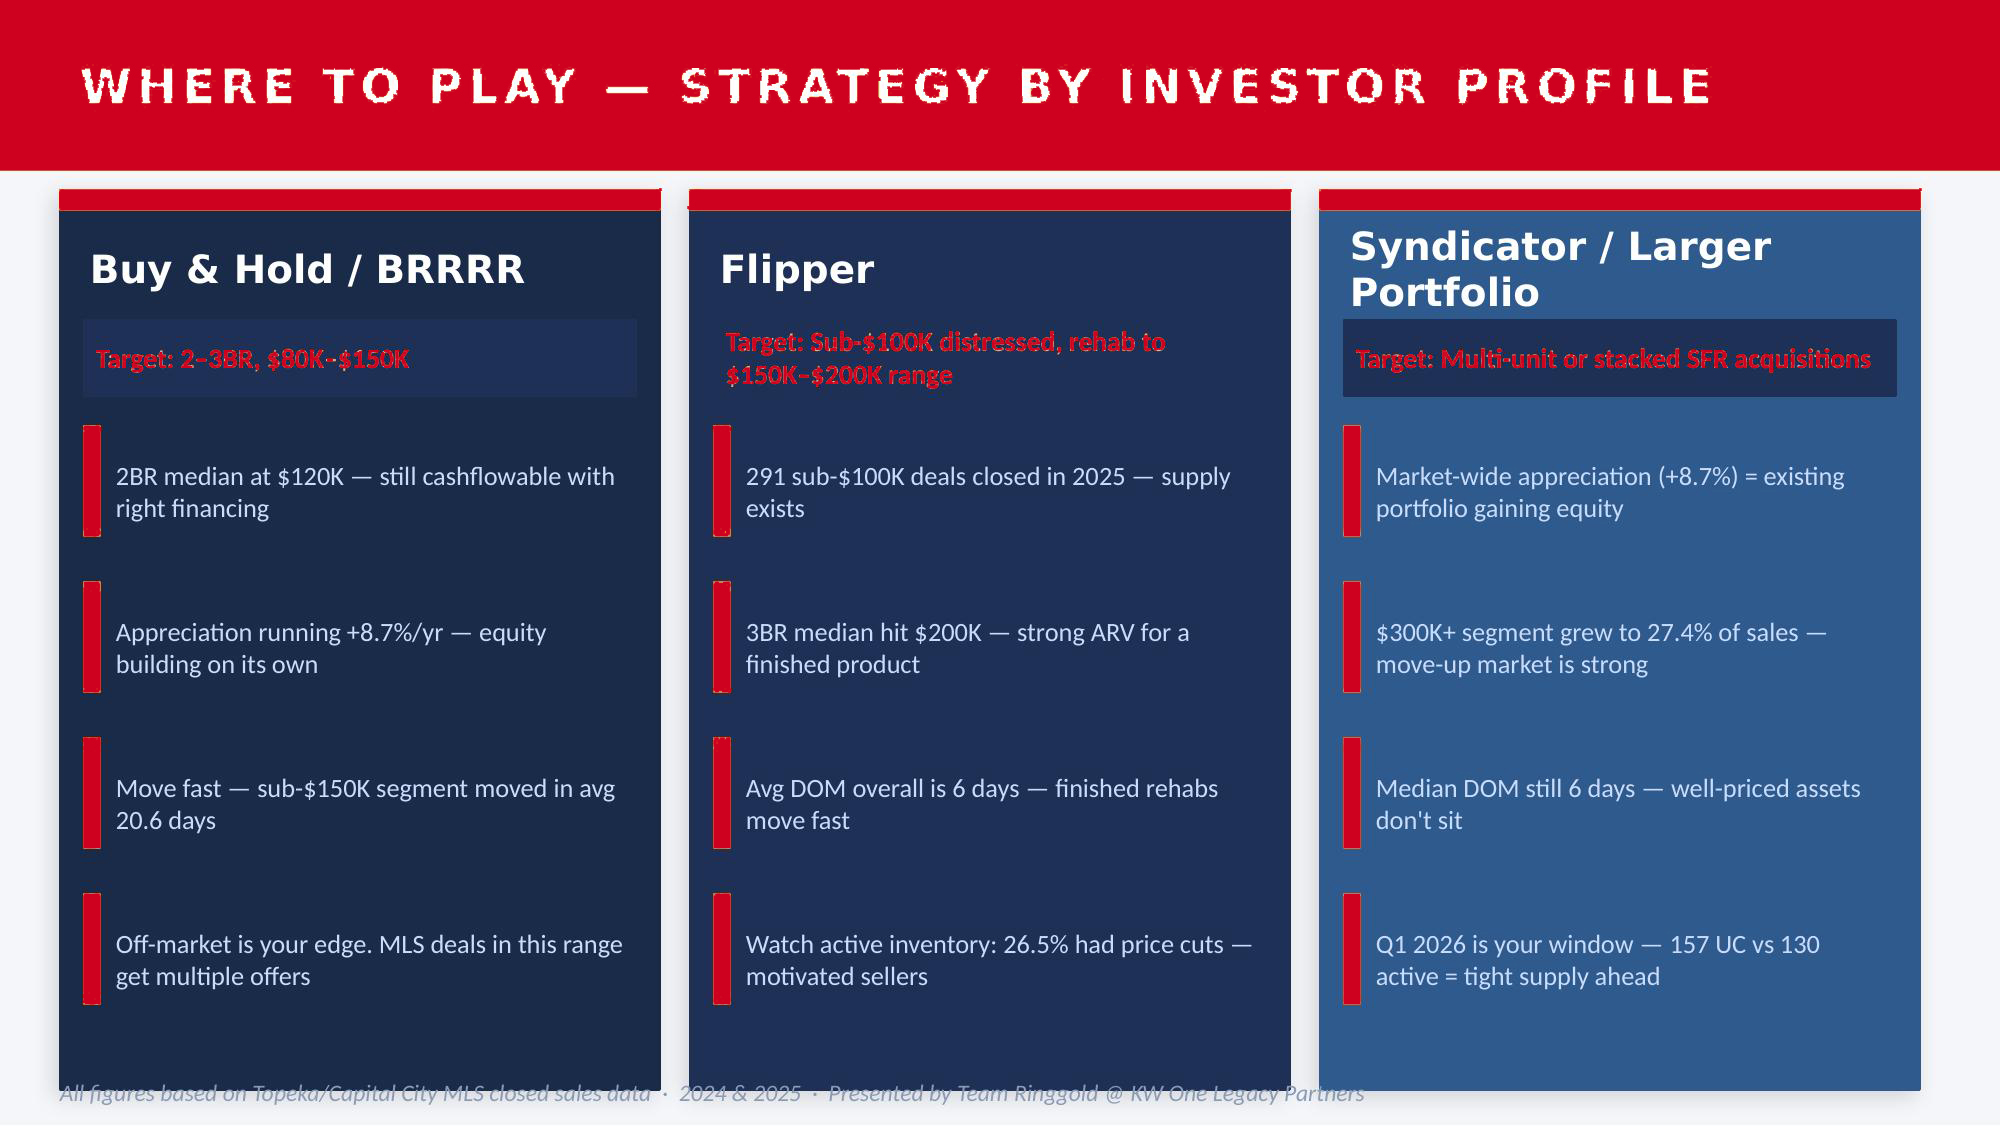
Where to Play — Strategy by Investor Profile
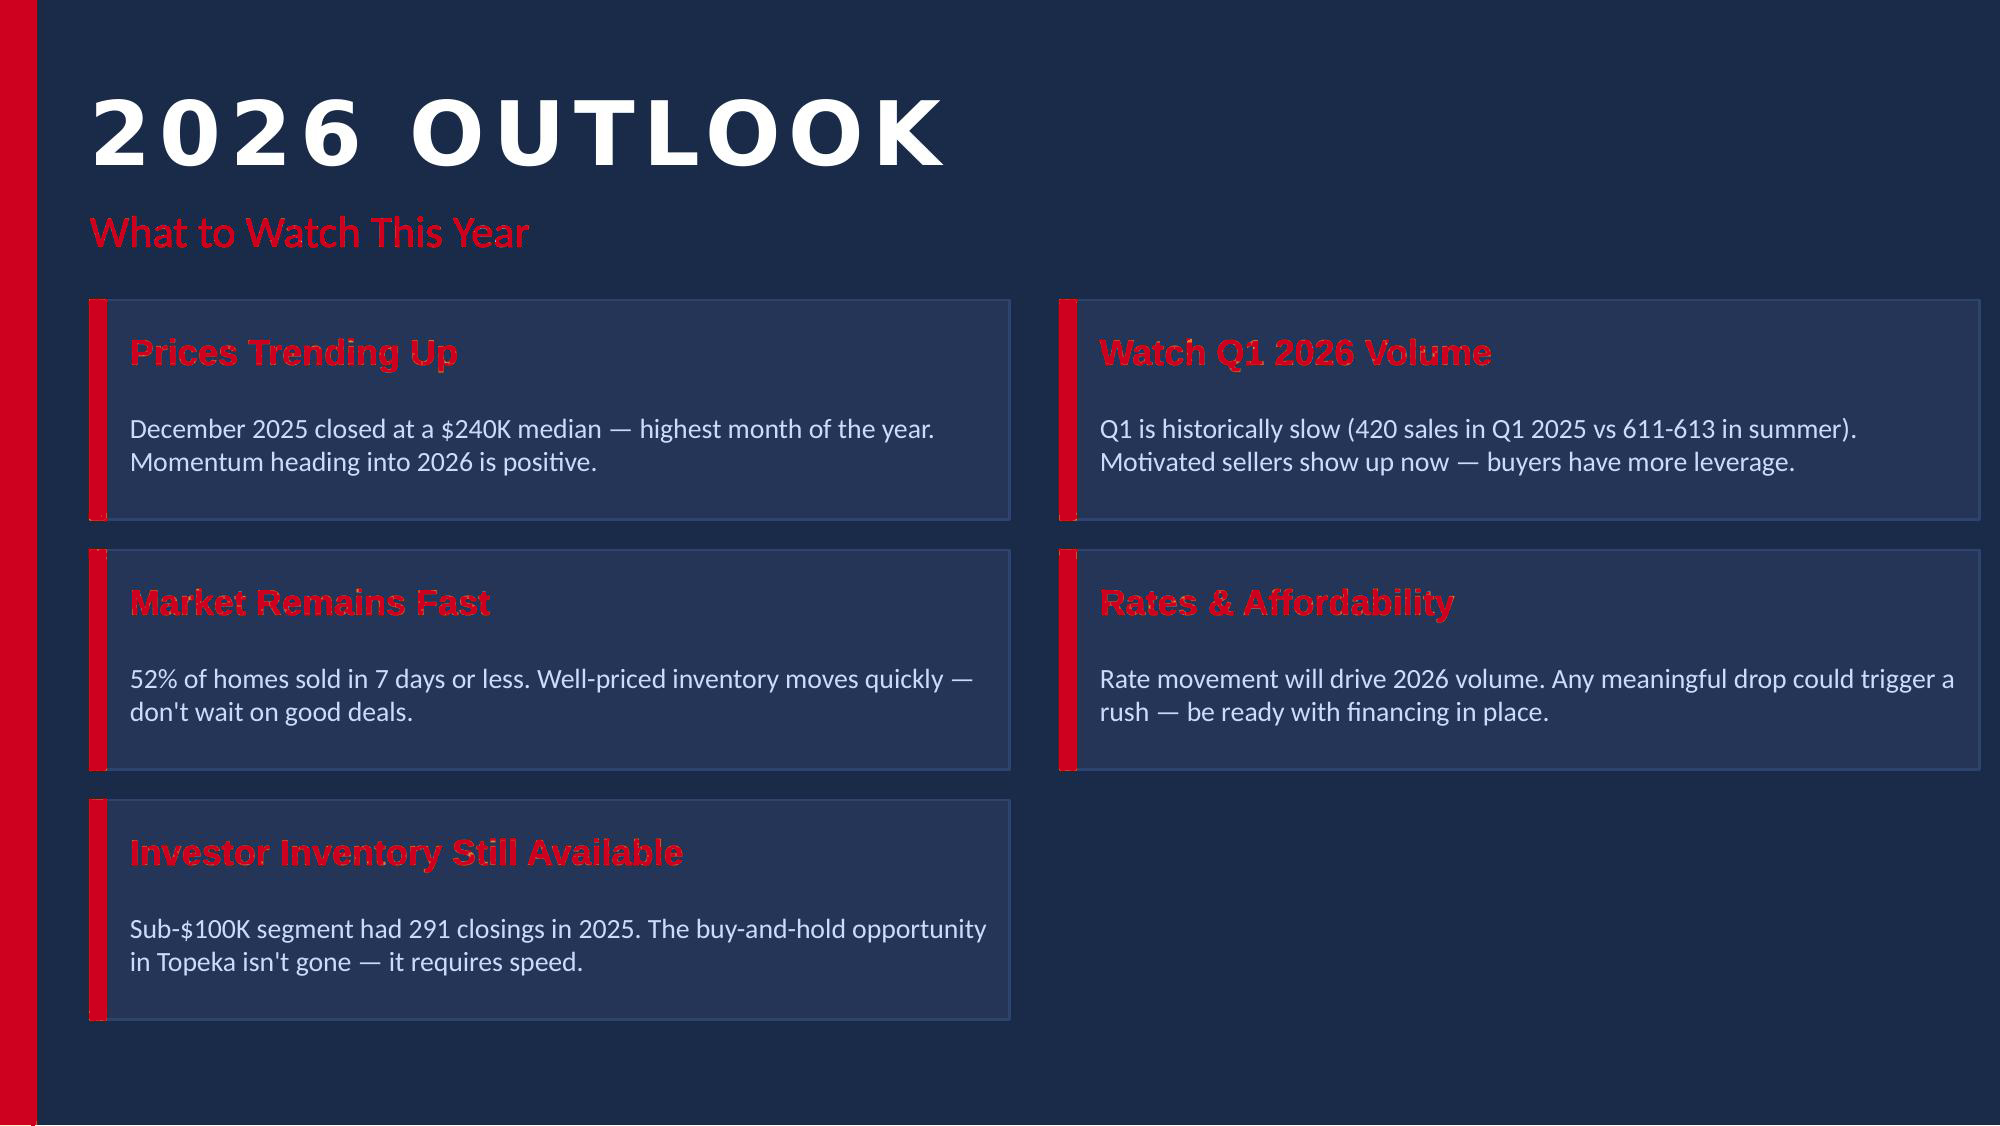
2026 Outlook — What to Watch This Year
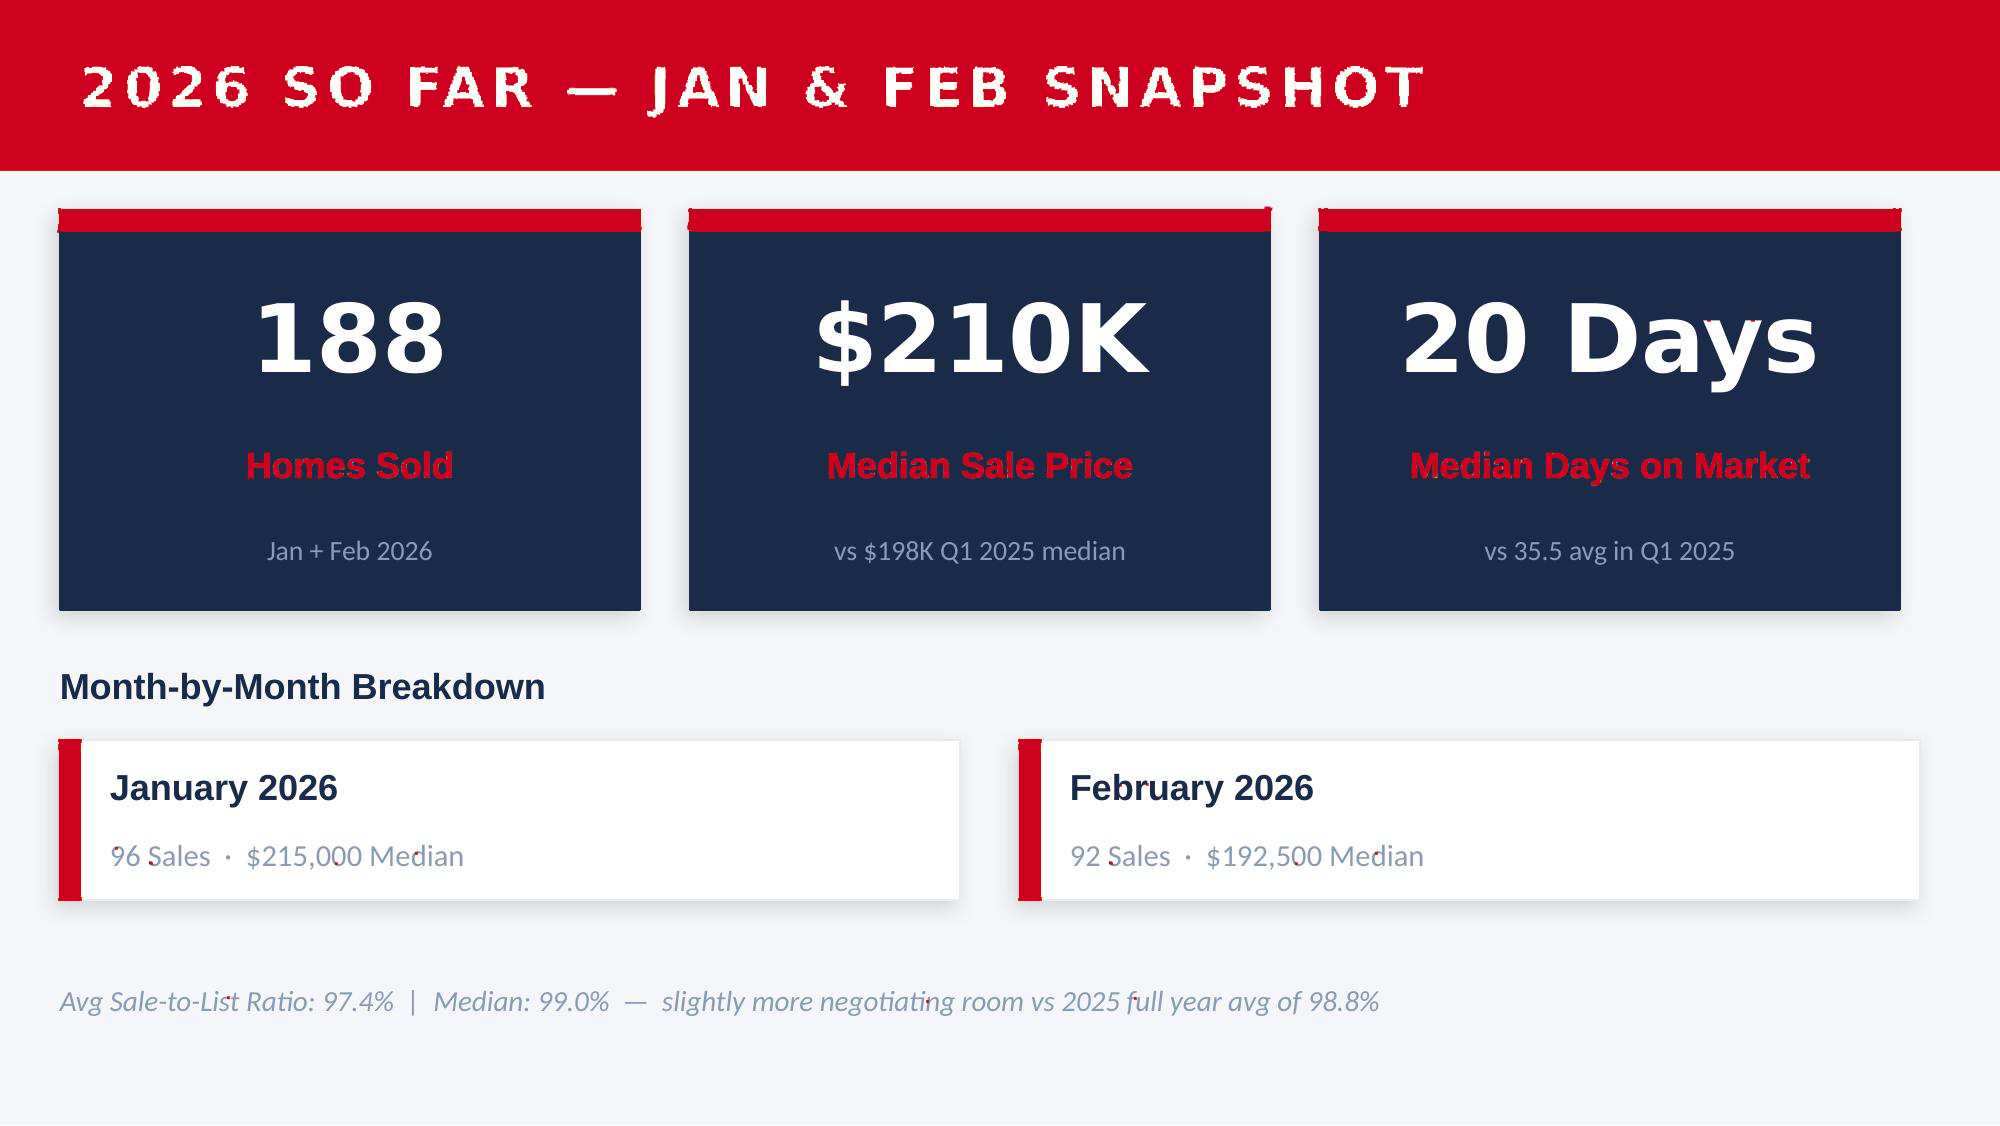
2026 So Far — January & February Snapshot
The first two months of 2026 are already telling us something. January and February together produced 188 sales — 96 in January with a $215,000 median, and 92 in February with a $192,500 median. The combined median of $210,000 tracks above the $198,000 median for Q1 2025. Prices are running ahead of last year.
Median days on market for the first two months came in at 20 days, down from the 35.5-day average seen in Q1 2025. The window of slightly less competition that exists right now will narrow as spring activity picks up.
2026 Pipeline — Active & Under Contract
There are currently 130 active listings in Topeka against 157 properties under contract. More homes are being absorbed than are coming to market — a signal that supply will remain tight heading into the spring season. It's also worth noting that 47.7% of active listings are priced at $300,000 or above, well above the 2025 sold median of $220,000. Seller expectations and actual market reality have some distance between them, which creates negotiating opportunity — particularly now, before the spring rush.
All data sourced from the Sunflower / Topeka Capital City MLS · Residential sales only
