
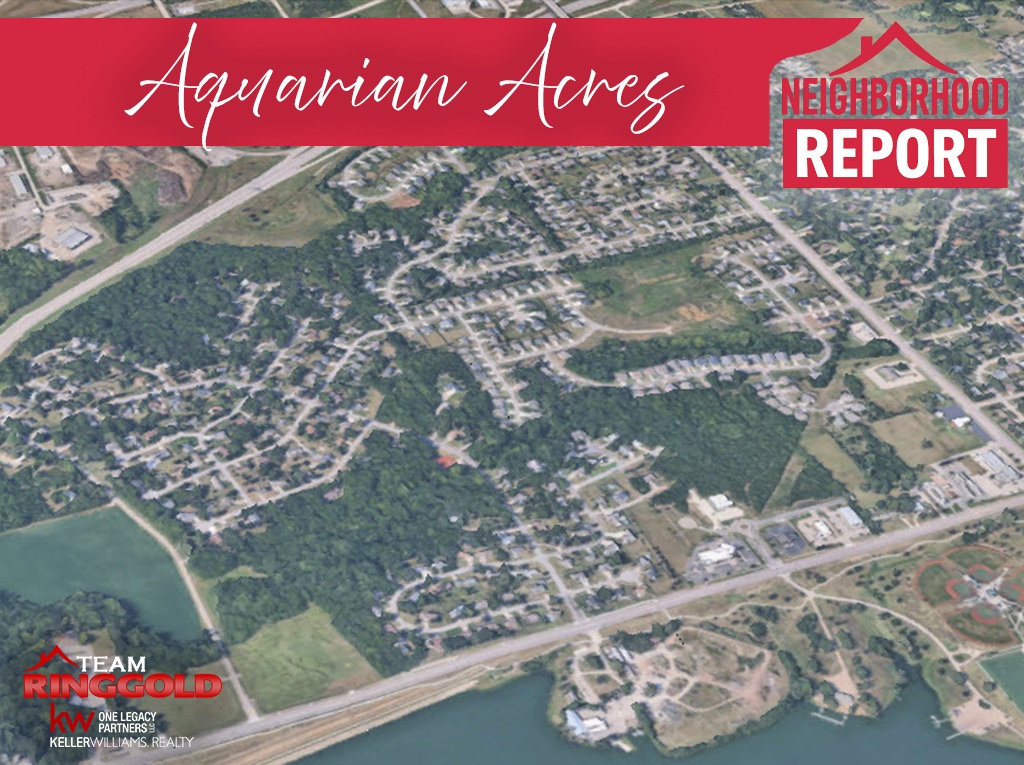
Neighborhood: Aquarian Acres
City, State: Topeka, Kansas
Report Period: Recent 24-Month Performance (October 2024 to October 2026)
Data Source: Sunflower MLS, 39 arm's-length sales analyzed
Report Generated: October 8, 2026
Thinking about buying or selling in Aquarian Acres? Here is what 39 recent sales tell us about prices, speed and negotiating room in this southeast Topeka neighborhood.
Aquarian Acres Topeka Quick Facts
| Metric | Value | Context |
|---|---|---|
| Average Home Price | $381,303 | Average sold price across 39 arm's-length sales in Aquarian Acres, Topeka, KS |
| Median Home Price | $381,900 | The middle sale price; half of homes sold for more, half for less |
| Price Range | $227,000 to $499,900 | Lowest to highest sold price; no sale reached $500,000 |
| Average Days on Market | 43.8 days | Pulled up by 5 homes that took 150+ days to sell |
| Median Days on Market | 11 days | The typical home sold in under two weeks |
| List-to-Sale Price Ratio | 99.3% | Average sold price as a share of final asking price; 97.1% of original list price |
| Year-Over-Year Change (Average Price) | -0.7% | $382,950 to $380,157 between the two most recent 12-month periods |
| Sales With Seller Concessions | 20.5% | 8 of 39 sales; average concession $11,121 |
| Average Home Size | 1,664 sq ft | Above-grade living area; average lot about 0.4 acres |
| Total Sales in Period | 39 | Total sold volume of $14,870,799 |
Aquarian Acres Real Estate FAQ: Prices, Days on Market and Trends
What is Aquarian Acres in Topeka, Kansas?
Aquarian Acres is a residential neighborhood in southeast Topeka, Kansas, where the streets carry zodiac and planet names like Pisces, Gemini, Scorpio, Saturn and Neptune. It is mostly ranch homes, with 87.2% of recent sales being ranches.
The typical home here sits on a lot of about 0.4 acres and offers around 1,664 square feet of above-grade living space. Homes range from 1970s builds to brand-new construction, which gives buyers a wide mix to shop from.
How much do homes cost in Aquarian Acres?
Over the past 24 months, the average home price in Aquarian Acres was $381,303, based on 39 sales. The median was $381,900, and prices ran from $227,000 to $499,900.
Most homes landed in the $300,000s and $400,000s. 19 sales fell between $300,000 and $399,999, and 15 sold between $400,000 and $499,999. Only 5 sold under $300,000.
How long does it take to sell a home in Aquarian Acres?
The average home in Aquarian Acres took 43.8 days to sell, while the median was just 11 days. Over the past 24 months, 15 of 39 homes (38.5%) sold within a week, and 24 (61.5%) sold within 30 days.
The gap between the average and median comes from 5 homes that sat for 150 days or more. Four of those five were built in 2023 or later. If your home is priced right out of the gate, the median is the better guide to what to expect.
Is Aquarian Acres a seller's market or a buyer's market?
Aquarian Acres is a balanced market with a two-speed pattern. Homes sold for 99.3% of their final asking price on average, and 18 of 39 sales (46.2%) closed at or above asking.
Well-priced homes move fast, with a median of 11 days on market. Homes that need price cuts, or that are priced above what the neighborhood has supported, can sit for months. No sale in this period came in more than 8.6% over asking, so this is not a bidding-war market.
How have Aquarian Acres home prices changed over the past year?
The average sold price in Aquarian Acres moved from $382,950 (August 2024 to July 2025) to $380,157 (August 2025 to July 2026), a change of -0.7% or -$2,793. The median moved from $398,950 to $380,000, a change of -4.7%.
Sales volume rose from 16 homes in August 2024 to July 2025 to 23 homes in August 2025 to July 2026, a +43.8% change. Closings in the earlier 12-month period begin in January 2025 in this data, so read the volume comparison as directional.
The takeaway is a stabilizing market: average prices held nearly flat while homes sold faster, with average days on market falling from 59.9 to 32.6.
Do homes in Aquarian Acres sell for asking price?
Yes, on average. Homes sold for 99.3% of final asking price, and 97.1% of the original list price. 18 of 39 homes sold at or above asking, 10 sold above it, and 21 sold below.
In the most recent 12-month period (August 2025 to July 2026), the average ratio improved to 99.6% from 98.8% in the prior period (August 2024 to July 2025). The biggest premium over asking was 8.6%.
What types of homes sell in Aquarian Acres?
Ranch homes make up 87.2% of Aquarian Acres sales, with 34 of 39 homes. Ranches averaged $382,103 and took 47.3 days to sell.
Split-level homes sold fast but are rare here, with 3 sales averaging $337,300 and 8.0 days on market. There was also one 2 Story and one 1.5 Story sale. With so few of those, treat them as directional only.
How do newer homes compare to older homes in Aquarian Acres?
Homes built in 2020 or later averaged $417,923, about 15.1% more than older homes at $362,992. That is a difference of about $54,931.
Older homes sold faster, though. Homes built before 2020 averaged 28.4 days on market, about 62% faster than newer homes at 74.7 days. Both groups sold near asking, at 99.1% for older homes and 99.6% for newer ones.
For a wider look at how this compares across the city, see our related Topeka neighborhood market reports below.
Is Aquarian Acres a good place to buy a home as an investment?
Prices in Aquarian Acres have held steady, with the average sold price changing -0.7% year over year. Homes also sold quickly in the most recent 12-month period, at an average of 32.6 days on market.
The neighborhood has sold mostly at or near asking, with 99.3% as the average list-to-sale ratio. That points to value retention rather than rapid appreciation. This is a look at past sales, not a forecast, so run your own numbers on any specific property.
Are sellers offering closing cost help in Aquarian Acres?
20.5% of Aquarian Acres sales included seller concessions, or 8 of 39 homes. The average concession was $11,121.
One new-construction sale included a $40,000 concession that pulls that average up. Without it, the average was $6,995, and the median across all concessions was $7,500. Most sellers did not offer help, but it shows up often enough that buyers should feel comfortable asking.
What is the price range for homes in Aquarian Acres?
Homes in Aquarian Acres sold for $227,000 to $499,900 over the past 24 months. No home sold for $500,000 or more.
Under $300,000: 5 sales, averaging 31.6 days on market. From $300,000 to $399,999: 19 sales at 40.1 days. From $400,000 to $499,999: 15 sales at 52.7 days. Higher price points took longer to sell.
What is the best time to sell a home in Aquarian Acres?
Homes listed from March through June sold in 19.2 days on average, compared with 64.9 days for homes listed the rest of the year. That is based on 18 spring listings and 21 listings in other months.
Spring listings also sold closer to asking, at 99.9% versus 98.8%. The sample is small, so treat it as a pattern worth planning around rather than a guarantee.
Aquarian Acres Topeka Housing Market Overview
Over the past two years, 39 homes sold in Aquarian Acres for a total of $14,870,799. The average sold price was $381,303, with a median of $381,900. Prices ranged from $227,000 to $499,900.
Speed looks two-sided. The average home took 43.8 days to sell, but the median was only 11 days. Homes sold for 99.3% of final asking price on average, and 97.1% of the original list price.
Put it together and Aquarian Acres reads as a balanced market with a two-speed pattern. Move-in-ready homes priced to the neighborhood sell fast. Homes that start too high, or that sit in the higher price bands, take longer and often need a price cut.
That is a healthy sign for value retention. Prices are steady, buyers are discerning, and sellers who price correctly are still getting results.
Deeper Dive: Aquarian Acres Market Trends and Analysis
Days on Market Analysis
The average is 43.8 days and the median is 11 days. They tell different stories. The median shows the typical experience: half of all homes sold in 11 days or less. The average gets pulled up by a handful of long listings. 5 homes took 150 days or more to sell, and four of those were built in 2023 or later.
For sellers: the first two weeks matter most. 15 homes (38.5%) sold in a week or less. Homes that took a price reduction averaged 96.2 days on market, versus 11.1 days for homes that never needed one.
For buyers: 24 of 39 homes (61.5%) sold within 30 days, so be ready to move on a good one. At the same time, 10 homes (25.6%) sat longer than 60 days, and those listings are where you will find the most flexibility.
Pricing Trends
The average list-to-sale ratio was 99.3%, which means homes sold very close to their final asking price. 18 homes (46.2%) sold at or above asking, with the biggest premium at 8.6%. That is a competitive market in spots, not a bidding-war market.
15 homes (38.5%) reduced their price before selling. The average reduction was $23,797, or about 5.8% of the original list price.
The growth picture is steady rather than speculative. The average sold price changed -0.7% year over year, which looks like a market catching its breath, not one running hot.
Year-Over-Year Snapshot
Here is how the two most recent 12-month periods compare. The average sold price moved from $382,950 to $380,157, a change of -0.7% or $2,793 lower. The median moved from $398,950 to $380,000, a change of -4.7%.
| Metric | August 2024 to July 2025 | August 2025 to July 2026 | Change |
|---|---|---|---|
| Average Sold Price | $382,950 | $380,157 | -0.7% |
| Median Sold Price | $398,950 | $380,000 | -4.7% |
| Homes Sold | 16 | 23 | +43.8% |
| Average Days on Market | 59.9 | 32.6 | -45.6% |
| Median Days on Market | 34.5 | 7.0 | -79.7% |
| List-to-Sale Ratio | 98.8% | 99.6% | +0.8 pts |
| Sales With a Price Reduction | 56.2% | 26.1% | -30.2 pts |
| Sales With Seller Concessions | 25.0% | 17.4% | -7.6 pts |
The median fell more than the average because of mix. The earlier period had a higher share of newer homes (6 of 16 built in 2020 or later, with an average build year of 2010), while the recent period leaned a bit older (average build year of 2004). That mix shift is the likely reason the middle of the market slipped more than the average.
Sales volume rose from 16 to 23 homes (+43.8%). Closings in the earlier period begin in January 2025 in this data set, so the volume comparison is directional rather than exact.
The bigger story is speed. Average days on market dropped from 59.9 to 32.6, and the share of homes needing a price cut fell from 56.2% to 26.1%. Prices held steady while the market got quicker.
Seller Concessions
8 of 39 sales (20.5%) included seller concessions. The average was $11,121, and the median was $7,500. One new-construction sale included $40,000, which lifts the average. Without it, the average was $6,995.
In plain terms, most sellers did not give anything, but about one in five did. Concessions are a negotiating tool here, not a given.
Newer Homes vs. Older Homes
Homes built in 2020 or later (13 sales) averaged $417,923 and 74.7 days on market. Older homes (26 sales) averaged $362,992 and 28.4 days. Newer homes carry a premium of about $54,931 (15.1%), but older homes sell about 62% faster.
When Homes Were Listed
Homes listed from March through June (18 sales) averaged 19.2 days on market and sold at 99.9% of asking. Homes listed in the other months (21 sales) averaged 64.9 days and sold at 98.8% of asking. Spring is the clear sweet spot in this neighborhood.
Aquarian Acres Home Styles Compared
Ranches dominate Aquarian Acres, so style-level numbers outside of ranches rest on very few sales and should be read as directional.
| Home Style | Homes Sold | Average Price | Median Price | Avg. Days on Market | List-to-Sale Ratio |
|---|---|---|---|---|---|
| Ranch | 34 | $382,103 | $384,500 | 47.3 | 99.2% |
| Split | 3 | $337,300 | $325,000 | 8.0 | 100.7% |
| 2 Story | 1 | $367,500 | $367,500 | 67.0 | 97.4% |
| 1.5 Story | 1 | $499,900 | $499,900 | 11.0 | 100.0% |
Ranch. This is the neighborhood's signature style, at 34 of 39 sales (87.2%). Buyers like single-level living, and many of these homes have finished basements. Ranches averaged $382,103 and 47.3 days on market, which is 7.9% slower than the neighborhood average of 43.8 days. Because ranches are most of the market, their numbers closely mirror the whole neighborhood.
Split level. Only 3 splits sold, but they stood out. They averaged $337,300, about $44,803 less than ranches (roughly 11.7% less). They sold in 8.0 days on average, about 82% faster than the neighborhood average. That makes them an affordable way into Aquarian Acres, though with only 3 sales this is directional.
2 Story and 1.5 Story. One of each sold. The 2 Story went for $367,500 in 67 days. The 1.5 Story sold for $499,900 in 11 days, the highest price in the data set. One sale each is not enough to call a trend.
What This Means for Aquarian Acres Sellers and Buyers
If You're Selling
Price it right the first time. Homes that took a price reduction averaged 96.2 days on market, compared with 11.1 days for homes that did not. Pricing near what the neighborhood supports at launch gets you more buyers in the first week, when attention is highest.
Prepare and present. With 18 of 39 homes selling at or above asking, clean, well-presented homes get rewarded. Think fresh paint, great photos and a tidy yard on those roughly 0.4-acre lots.
Be ready to talk concessions. About one in five sales included seller help. If you expect it, you can build it into your pricing strategy instead of reacting to it.
Mind the calendar. Homes listed from March through June sold in 19.2 days on average, versus 64.9 for the rest of the year. If you have flexibility, plan to list in spring.
If You're Buying
Offer strategy. Homes sold at 99.3% of asking on average, so a full-price offer on a well-priced home is realistic. 10 homes sold above asking, though none by more than 8.6%. On homes that have been listed for a while or have had a price cut, there is room to negotiate.
Get financing lined up early. 61.5% of homes sold within 30 days, and 38.5% sold within a week. A pre-approval letter in hand lets you move when the right home hits the market.
Know your leverage. You will have the most negotiating room on homes that have sat for 60+ days. Across all sales that took a price cut, the average reduction was $23,797. On fresh, well-priced listings, expect competition.
Looking Ahead
The fundamentals look steady. Average prices are essentially flat year over year, homes are selling faster, and fewer sellers are cutting prices. That is what a stabilizing market looks like.
The neighborhood's appeal is easy to see: mostly ranch homes, generous lots and a mix of ages and price points. One thing to watch is the top of the market. No home sold for $500,000 or more in this period, and a few of the most recent listings in the data are asking between $515,000 and $565,000. How those perform will tell us whether buyers will pay more for newer construction here.
Talk With Team Ringgold About Aquarian Acres
Thinking about selling? We will put together a free, no-obligation home valuation based on what has actually sold in Aquarian Acres, not a guess. Request your home valuation.
Thinking about buying? We can walk you through current listings, what offers are working and what to expect on timing. Start a conversation with our team.
Just have questions? No pressure and no sales pitch. If you want to talk through the market, we are happy to help. Reach out anytime.
Team Ringgold, Keller Williams One Legacy Partners, Topeka, Kansas
More Topeka Neighborhood Market Reports
- Indian Hills Real Estate Market Report
- Brookfield Real Estate Market Report
- Sterling Chase Real Estate Market Report
- Topeka and Shawnee County Market Report
Aquarian Acres Structured Data Summary
- Neighborhood: Aquarian Acres
- City: Topeka
- State: Kansas
- Data Source: Sunflower MLS
- Analysis Period: October 2024 to October 2026 (sold closings in the data run January 09, 2025 to July 31, 2026)
- Total Arm's-Length Sales: 39
- Total Sold Volume: $14,870,799
- Average Sold Price: $381,303
- Median Sold Price: $381,900
- Lowest Sold Price: $227,000
- Highest Sold Price: $499,900
- Average Days on Market: 43.8
- Median Days on Market: 11
- Sold Within 7 Days: 15 homes (38.5%)
- Sold Within 30 Days: 24 homes (61.5%)
- Average List-to-Sale Ratio (Final Asking Price): 99.27%
- Average Sale-to-Original List Price Ratio: 97.07%
- Sold At or Above Asking: 18 homes (46.2%)
- Homes With a Price Reduction: 15 (38.5%); average reduction $23,797
- Sales With Seller Concessions: 8 (20.5%); average $11,121; median $7,500
- Year-Over-Year Average Price (August 2024 to July 2025 to August 2025 to July 2026): $382,950 to $380,157, -0.73%
- Year-Over-Year Median Price (August 2024 to July 2025 to August 2025 to July 2026): $398,950 to $380,000, -4.75%
- Year-Over-Year Sales Volume (August 2024 to July 2025 to August 2025 to July 2026): 16 to 23, +43.8%
- Home Style Distribution: Ranch 34 (87.2%); Split 3 (7.7%); 2 Story 1 (2.6%); 1.5 Story 1 (2.6%)
- Off-Market Sales Excluded From Headline Metrics (Sold Before Process MLS): 4 transactions, average $263,750
- Market Characterization: Balanced market with a two-speed pattern
