
Indian Hills Quick Facts
| Metric | Value | Context |
|---|---|---|
| Median Sold Price | $259,500 | Primary benchmark for typical home value |
| Average Sold Price | $274,654 | Pulled up modestly by higher-end sales |
| Price Range | $180,000 - $440,000 | Reflects full mix of home sizes and styles |
| Average Days on Market | 17.8 days | Skewed higher by a handful of slower-moving listings |
| Median Days on Market | 5.5 days | Better reflection of a typical, well-priced home |
| List-to-Sale Price Ratio | 100.0% | Homes are selling right at asking price on average |
| Price Per Square Foot | $219.20 (median) | Based on above-grade finished square footage |
| Year-Over-Year Growth | -6.6% (median) | August 2024-2025 vs. August 2025-2026 |
| Total Sales in Period | 64 | Arm's-length MLS sales over the past 24 months |
Frequently Asked Questions About the Indian Hills Market
What is Indian Hills in Topeka?
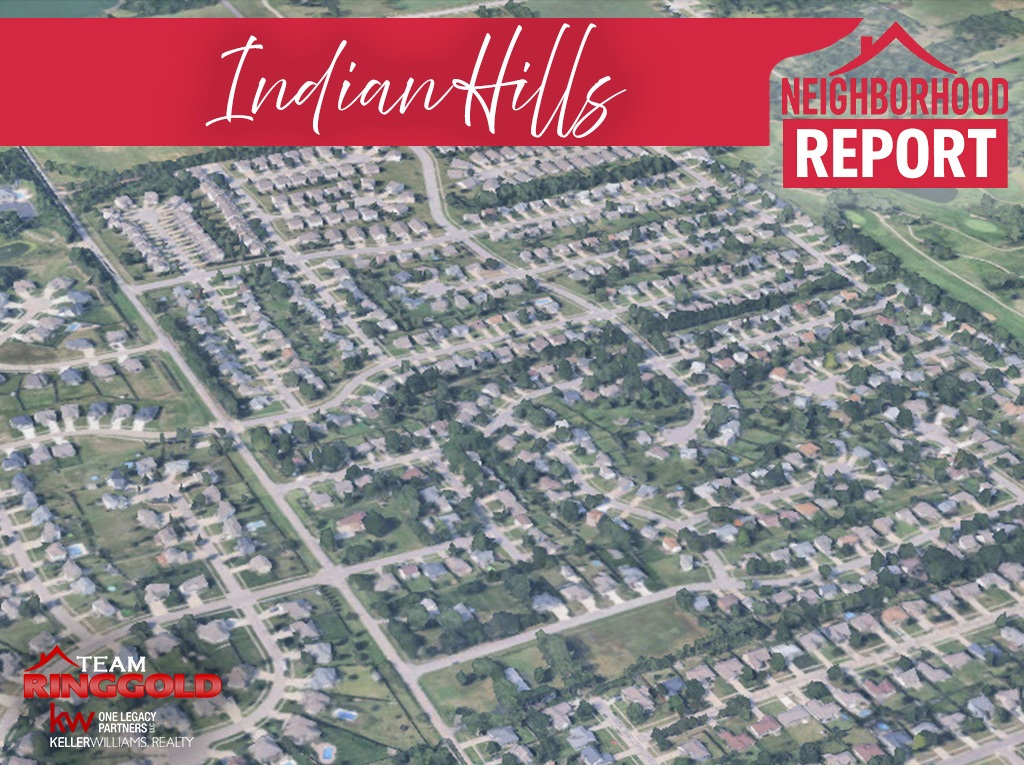
Indian Hills is an established residential neighborhood on Topeka's west side, built predominantly with ranch and bi-level homes from the 1970s through the 1990s. It's known for quick sale times, a strong list-to-sale ratio, and a housing stock that appeals to move-up buyers, downsizers, and single-level-living seekers alike.
Over the past 24 months, 64 homes have sold in the neighborhood through Sunflower MLS, giving a solid dataset for understanding how the local market actually behaves.
How much do homes cost in Indian Hills?
The median sold price in Indian Hills over the past 24 months is $259,500, with an average of $274,654. Prices have ranged from $180,000 up to $440,000, covering everything from smaller starter ranches to larger executive-style homes.
The gap between the median and average is explained mostly by a small number of higher-end sales, including one $440,000 Blue Stem Drive ranch that sits well above the rest of the neighborhood's price range.
How long does it take to sell a home in Indian Hills?
The median days on market in Indian Hills is just 5.5 days, though the average of 17.8 days is pulled up by a smaller group of homes that took longer to find a buyer. For most sellers, that median number is the more realistic expectation: well-priced homes in this neighborhood are moving quickly.
Buyers should expect to move fast if they want to be competitive here, especially on homes priced in line with recent comparable sales.
Is Indian Hills a seller's market or buyer's market?
Indian Hills currently leans toward a balanced-to-seller's market. A 100.0% list-to-sale ratio and a 5.5-day median days on market both point to strong demand, but a 6.6% median price pullback over the past year and a 25.0% price-reduction rate show that pricing discipline still matters. This isn't a market where sellers can price aggressively and expect a bidding war.
Are home prices increasing or decreasing in Indian Hills?
Home prices in Indian Hills have softened over the past year. The median sold price declined 6.6%, from $270,000 in the August 2024-2025 period to $252,200 in the August 2025-2026 period. The average sold price declined a smaller 2.6% over the same span, from $278,316 to $271,213.
Sales volume actually ticked up slightly, from 31 sales to 33 sales year-over-year, which suggests this is a cooling in price rather than a drop-off in buyer interest.
What types of homes sell best in Indian Hills?
Ranch homes dominate the Indian Hills market, accounting for 57.8% of all sales (37 of 64), with a median price of $283,000. Bi-Level homes are the second most common style at 26.6% of sales (17 of 64), with a median price of $238,000, and they also sell noticeably faster than the neighborhood average.
Do homes in Indian Hills sell for asking price?
Yes. Homes in Indian Hills are selling at an average 100.0% of their final asking price, meaning most sellers are getting essentially full price. That said, 25.0% of sales did see a price reduction along the way, averaging $21,450, which shows that initial pricing still needs to be grounded in the comps.
How does Indian Hills compare to other Topeka neighborhoods?
Indian Hills sits in the middle-to-upper range of Topeka's established west-side neighborhoods, priced above many older neighborhoods closer to downtown but below newer subdivisions further southwest. The combination of a quick median sale time, a full-price list-to-sale ratio, and a ranch-dominant housing stock gives it broad appeal to move-up buyers and single-level-living seekers.
What is the price per square foot in Indian Hills?
The median price per square foot in Indian Hills is $219.20, based on above-grade finished area, with the average nearly identical at $218.87. That consistency between median and average suggests pricing per square foot is fairly stable across the neighborhood, even though total sale prices vary more by home size and style.
Are sellers offering closing cost assistance in Indian Hills?
26.6% of sales in Indian Hills included some form of seller concession, averaging $5,219 when offered. That's a meaningful minority of deals, and it's worth factoring into offer strategy on both sides of the table.
Is Indian Hills a good investment?
Indian Hills offers steady, if not explosive, fundamentals: consistent sales volume (actually up slightly year-over-year), fast turnover on well-priced homes, and a dominant ranch product type with broad, durable buyer appeal. The recent 6.6% median price pullback is worth watching, but it reads more like a market finding its level after a strong run than a sign of declining demand.
For buy-and-hold investors, the neighborhood's affordability relative to newer west Topeka construction, combined with a track record of homes selling near full price, makes it a reasonable candidate for rental or long-term appreciation plays, though as always, individual property condition and specific block matter more than neighborhood averages.
What's the best time to sell a home in Indian Hills?
The data doesn't point to one dramatic seasonal window, but with a median days-on-market of just 5.5 days across the full 24-month period, well-priced homes in Indian Hills sell quickly in nearly any season. The bigger driver of a fast, full-price sale here is accurate initial pricing rather than timing the calendar.
Indian Hills Market Overview
Indian Hills is a well-established west Topeka neighborhood built primarily around ranch and bi-level homes, and over the past 24 months it has behaved like a market that generally knows its own value. Sixty-four arm's-length sales closed in that window, with a median sold price of $259,500 and an average of $274,654. The gap between those two numbers is driven mostly by a small cluster of higher-end sales at the top of the range rather than a broad price spread across the neighborhood.
Market speed is one of the neighborhood's standout traits. The median days on market sits at just 5.5 days, meaning that a typical, well-priced home is under contract almost as soon as it hits the market. The average of 17.8 days is skewed by a handful of properties that lingered longer, but for most sellers, the median is the more useful planning number.
Pricing discipline still shows up in the data: 25.0% of sales saw a price reduction before closing, and 26.6% of sellers offered some form of concession. Combined with a 100.0% list-to-sale ratio, this points to a balanced market with a slight seller's edge, where accurately priced homes move fast and full price, but overpriced listings still get corrected along the way.
Deeper Dive: Indian Hills Pricing and Market Speed
Days on Market Analysis
The split between average (17.8 days) and median (5.5 days) days on market tells an important story. A small number of slower-selling homes, likely those priced above the market or with condition issues, pull the average well above what most sellers actually experience. For pricing strategy purposes, the median is the more honest benchmark: homes priced in line with recent comparable sales are typically finding buyers within a week.
For buyers, this means urgency matters. If a home is priced right for the neighborhood, there usually isn't much time to deliberate before it's under contract.
Pricing Trends
The 100.0% list-to-sale ratio shows that, on average, homes are closing right at their final asking price. But that number reflects the asking price after any adjustments, not necessarily the original list. A quarter of sales (25.0%) did see a price reduction along the way, averaging $21,450, which is a meaningful gap and a reminder that overpricing still gets corrected by the market rather than by buyer bidding.
The year-over-year figures point toward a market that's cooling modestly on price. That's discussed in detail in the Year-Over-Year Snapshot below.
Year-Over-Year Snapshot (August 2024-2025 vs. August 2025-2026)
In the first 12-month period, August 2024 through August 2025, the median sold price was $270,000 and the average was $278,316. In the second 12-month period, August 2025 through August 2026, the median dropped to $252,200 and the average to $271,213.
That's a median decline of $17,800 (-6.6%) and a smaller average decline of $7,103 (-2.6%). The fact that the average held up better than the median suggests the softening is broad-based across typical homes rather than concentrated in the high end. Sales volume actually increased over the same span, from 31 transactions to 33, which points to a market that's finding a new price level rather than losing buyer interest.
Seller Concessions
Just over a quarter of sellers, 26.6%, offered some form of concession to buyers, averaging $5,219 when included. That's not a dominant trend, but it's common enough that buyers shouldn't assume concessions are off the table, and sellers should budget for the possibility when setting their net proceeds expectations.
Indian Hills Home Style Comparison
| Home Style | Homes Sold | Average Price | Median Price | Avg. Days on Market | List-to-Sale Ratio |
|---|---|---|---|---|---|
| Ranch | 37 | $290,225 | $283,000 | 15.2 days | 99.8% |
| Bi-Level | 17 | $237,941 | $238,000 | 10.2 days | 100.9% |
| 1.5 Story | 5 | $304,400 | $307,000 | 62.2 days | 96.7% |
| Split | 4 | $253,750 | $250,000 | 22.8 days | 101.3% |
| 2 Story | 1 | $257,500 | $257,500 | 1.0 day | 100.0% |
Ranch homes are the backbone of the Indian Hills market, making up 57.8% of all sales. They command a meaningful premium over Bi-Level homes: Ranch homes are approximately 22.0% more expensive on average ($290,225 vs. $237,941), a gap of $52,284, and about 18.9% more expensive on a median basis ($283,000 vs. $238,000), a gap of $45,000. That premium reflects the single-level living that ranch homes offer, which remains highly sought after among move-up buyers and downsizers alike.
Bi-Level homes offer real savings for buyers willing to consider a split-entry floor plan, and they're also the fastest-selling style in the neighborhood. At a 10.2-day average days on market, Bi-Level homes sell approximately 42.4% faster than the neighborhood average of 17.8 days. Combined with the price gap versus ranches, Bi-Levels represent one of the better value opportunities in Indian Hills for buyers focused on affordability.
1.5 Story homes command the highest average and median prices in the neighborhood, but with only 5 sales and a much longer 62.2-day average days on market, this segment should be read as directional rather than statistically definitive. Split-style homes (4 sales) and the single 2 Story sale are similarly small samples and should be treated as single or limited data points rather than reliable trend indicators.
Note: One Ranch sale on Blue Stem Drive closed at $440,000, well above the neighborhood's typical range, and was flagged as a statistical outlier using IQR methodology. It's included in the Ranch figures above but is worth keeping in mind when interpreting the Ranch average specifically.
What the Indian Hills Market Means for You
If You're Selling
Price to the median, not the average. With a median sale price of $259,500 and a median days-on-market of just 5.5 days, homes priced in line with recent comparable sales are moving fast and at full price. Reaching for the average or for the top of the range risks landing your home in the 25.0% that need a price correction.
Ranch homes have the edge. If your home is a ranch, you're in the neighborhood's most in-demand style, commanding roughly a 19-22% premium over Bi-Level homes. Lean into that in your marketing and pricing strategy.
Budget for the possibility of a concession. More than a quarter of sellers (26.6%) offered some form of concession, averaging $5,219. It's not the norm, but it's common enough to plan for in your net proceeds estimate.
If You're Buying
Move quickly on well-priced listings. A median of 5.5 days on market means there's little room to deliberate once a home priced right for the neighborhood hits the market. Have financing ready to go before you start touring.
Consider Bi-Level homes for value. They sell for roughly 19-22% less than Ranch homes and move even faster, making them a strong option if floor plan flexibility isn't a dealbreaker.
Watch the 25% of homes with price reductions. Those situations often represent sellers who have become more realistic on price, and patient buyers who track those listings can find genuine opportunities.
Looking Ahead
Indian Hills has the fundamentals that keep an established neighborhood relevant over time: a dominant, broadly appealing product type in ranch homes, a price point that remains accessible relative to newer west Topeka construction, and a consistent track record of fast, near-full-price sales. The 6.6% median price pullback over the past year is worth watching, but rising sales volume alongside it suggests this is a market recalibrating rather than losing demand.
As affordability pressure continues to push some buyers away from new construction, well-maintained, move-in-ready homes in established neighborhoods like Indian Hills should continue to see steady interest.
Ready to Talk About Your Indian Hills Home?
Thinking about selling? Pricing strategy makes or breaks outcomes in this market. I can put together a current market analysis specific to your home's style, size, and condition so you know exactly where you stand before you list. No pressure, just numbers.
Looking to buy? Indian Hills moves fast when homes are priced right. If you want to be competitive here, it helps to have someone who knows the inventory and can move quickly when the right home comes up. Let's talk about what you're looking for.
Just curious? That's fine too. If you're a homeowner in Indian Hills wondering what your home is worth right now, I'm happy to give you an honest read, no sales pitch required.
Reach out to Team Ringgold at Keller Williams One Legacy Partners whenever you're ready, or visit searchtopekahomes.com to explore current listings.
Indian Hills Market Data Summary
Neighborhood: Indian Hills
City, State: Topeka, Kansas
Analysis Period: September 3, 2024 - August 6, 2026 (approx. 24 months)
Total Arm's-Length Transactions: 64
Off-Market Transactions (Sold Before Process MLS, excluded from headline metrics): 3 (median $210,000)
Excluded Active/Under Contract Listings: 5
Median Sold Price: $259,500
Average Sold Price: $274,654
Price Range: $180,000 - $440,000
Median Price Per Sq Ft (above grade): $219.20
Average Price Per Sq Ft (above grade): $218.87
Average Days on Market: 17.8 days
Median Days on Market: 5.5 days
List-to-Sale Price Ratio: 100.0%
Price Reduction Frequency: 25.0% of sales (avg. reduction $21,450)
Seller Concession Frequency: 26.6% of sales (avg. concession $5,219)
Year-Over-Year Comparison (Aug 2024-2025 vs. Aug 2025-2026):
Median Price: $270,000 → $252,200 (-6.6%, -$17,800)
Average Price: $278,316 → $271,213 (-2.6%, -$7,103)
Sales Volume: 31 → 33 (+6.5%)
Home Style Distribution: Ranch 57.8% (37), Bi-Level 26.6% (17), 1.5 Story 7.8% (5), Split 6.2% (4), 2 Story 1.6% (1)
Statistical Outlier Flagged (IQR method): One Ranch sale at $440,000 (2746 SW Blue Stem DR)
Market Characterization: Balanced market with a slight seller's edge — homes priced accurately are selling near full price in about a week, while prices overall have softened modestly year-over-year.
