
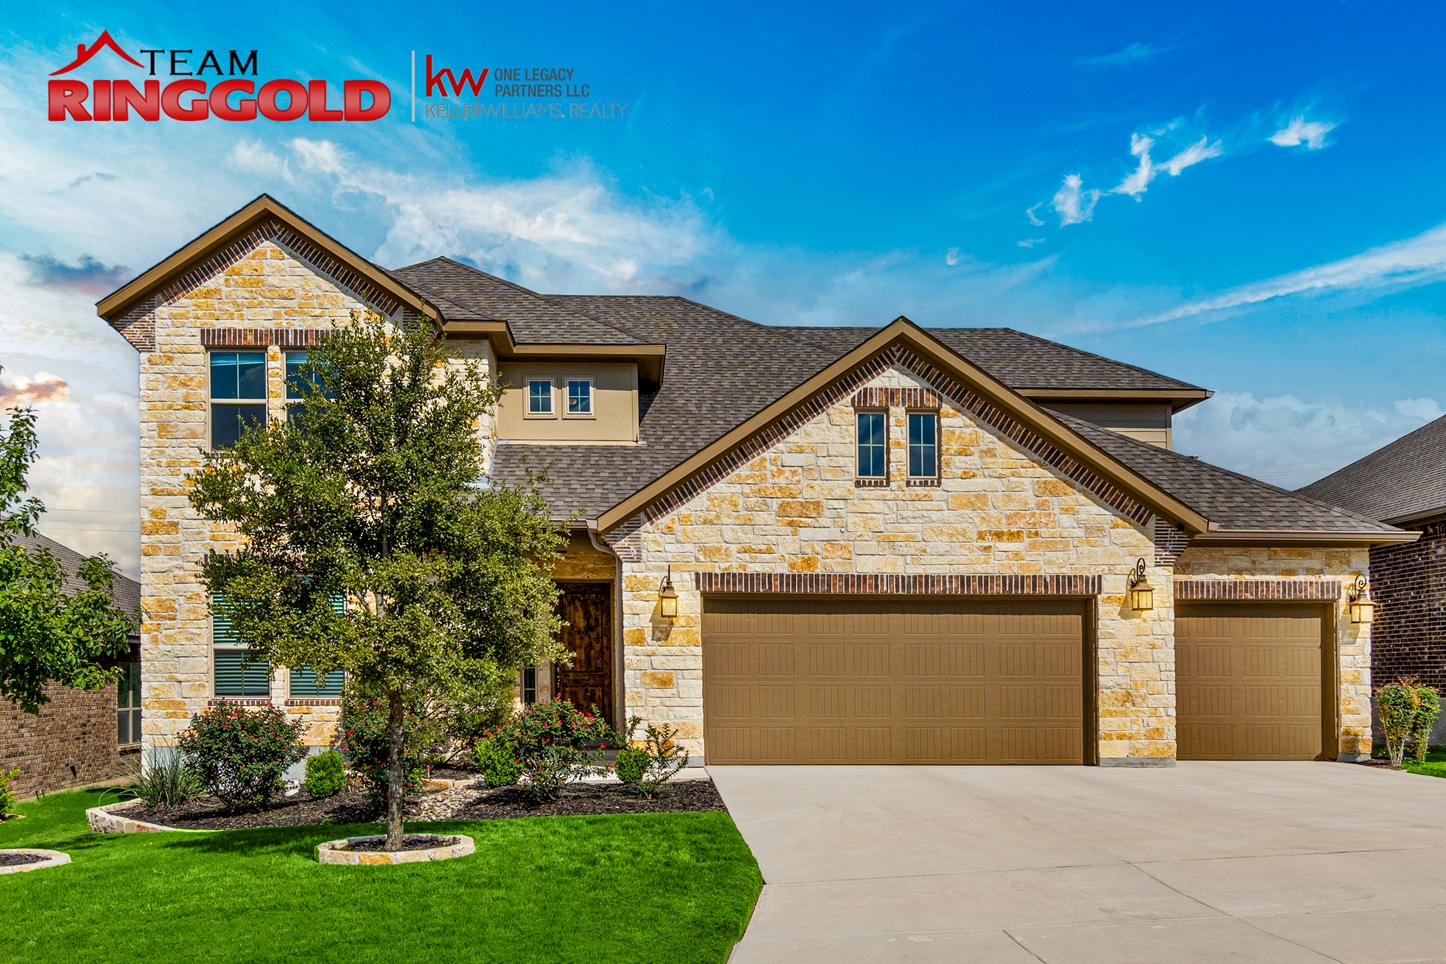
Sterling Chase is one of the more sought-after newer neighborhoods in northwest Topeka, and the past two years of sales data shows exactly why. Buyers continue to pay strong prices for both existing homes and new builds, year-over-year median values have climbed past 6%, and sales volume jumped 45% from one year to the next. This report breaks down what 27 closed sales actually tell us about pricing, pace, and where the neighborhood is headed.
Sterling Chase Home Prices: Quick Facts
| Metric | Value | Context |
|---|---|---|
| Median Sold Price | $480,000 | Half of homes sold above this, half below |
| Average Sold Price | $460,008 | Pulled down slightly by a few smaller, older properties |
| Price Range | $230,000 – $612,500 | From smaller resale homes up to premium new construction |
| Median Days on Market | 5 days | The typical home goes under contract within a week |
| Average Days on Market | 26.3 days | Higher than median, reflecting a few longer-marketed listings |
| List-to-Sale Price Ratio | 100% (median) | The typical home sells for exactly its asking price |
| Median Price per Sq Ft | $244 | Based on above-grade finished square footage |
| Year-Over-Year Median Growth | +6.04% | Median climbed from $462,500 to $490,450 year-over-year |
| Total Sales Analyzed | 27 | Closed transactions during the recent 24-month period |
Sterling Chase Real Estate Questions: Answered with Data
What is Sterling Chase in Topeka, Kansas?
Sterling Chase is a residential neighborhood in northwest Topeka, Kansas, made up primarily of ranch-style homes built between 1999 and 2025. The neighborhood sits along NW Sterling Chase Drive and adjacent streets including Beaumont ST, Derby DR, Fielding RD, and 49th TER, and is known for newer construction, larger lots, and strong resale values. It is one of Topeka's higher-priced neighborhoods, with a median home sale price of $480,000 over the past 24 months. Active new construction continues to add inventory, particularly along Beaumont ST and Derby DR.
How much do homes cost in Sterling Chase?
The median home in Sterling Chase sold for $480,000 over the past 24 months, with an average sale price of $460,008. Most homes traded between $400,000 and $550,000. The lowest sale closed at $230,000 and the highest reached $612,500. Sterling Chase sits well above Topeka's citywide median, reflecting its newer housing stock, spacious ranch floor plans, and desirable northwest location.
Are home prices increasing or decreasing in Sterling Chase?
Home prices in Sterling Chase are increasing. The median sold price rose 6.04% year-over-year, climbing from $462,500 in the prior 12 months (May 2024 – May 2025) to $490,450 in the most recent 12 months (May 2025 – May 2026). The average price increased 7.49% over the same period, from $440,454 to $473,451. Sales volume also rose 45%, from 11 to 16 closings. Rising prices alongside rising volume signals expanding demand, not just scarcity.
How long does it take to sell a home in Sterling Chase?
The typical Sterling Chase home goes under contract in 5 days (median). The average across all sales is 26.3 days, pulled higher by a handful of properties that sat for 50, 80, or 100+ days due to aggressive initial pricing. Homes priced correctly from the start sell fast. Homes that overshoot the market tend to sit visibly before a price correction brings buyers back.
Is Sterling Chase a seller's market or a buyer's market?
Sterling Chase is currently a seller's market. The median list-to-sale ratio is 100% and the median time on market is just 5 days. That said, about 30% of sellers had to reduce their asking price before going under contract, with an average reduction of $14,997. Buyers are paying full price for well-positioned homes, but they're disciplined enough to walk away from listings that miss the mark on value.
Is Sterling Chase a good investment?
Based on recent market data, Sterling Chase shows strong investment fundamentals. The neighborhood posted 6.04% year-over-year median price growth, sales volume increased 45% from one year to the next, and active new construction continues to signal confidence in the area's long-term appeal. Rising prices alongside rising demand volume are the conditions that tend to support sustained appreciation. Individual results always depend on the specific property, purchase price, and holding period, but the neighborhood-wide trends are clearly positive.
How does Sterling Chase compare to other Topeka neighborhoods?
Sterling Chase sits in the upper tier of the Topeka market. Its $480,000 median is significantly higher than Topeka's citywide median and above most other northwest Topeka neighborhoods. It offers a similar quality of newer construction to the Auburn-Washburn corridor but with a quieter, more established feel. For buyers choosing between parts of northwest and southwest Topeka, Sterling Chase represents one of the stronger combinations of price appreciation, newer ranch homes, and single-level living. See our related reports for Sherwood Lake, West Hills & Cedar Crest, and Indian Hills for side-by-side neighborhood context.
What types of homes are in Sterling Chase?
Sterling Chase is 89% ranch-style homes, with 24 of 27 sales being ranches. The remaining sales included two raised ranches and one 1.5-story home. Homes range from approximately 1,400 to 2,500+ above-grade square feet, with many featuring finished basements that add significant living space. Year built ranges from 1999 through 2025, with new construction still underway. Buyers looking for single-level living in a newer Topeka neighborhood will find Sterling Chase one of the best options available.
Do homes in Sterling Chase sell for asking price?
Yes, most do. The median list-to-sale ratio is exactly 100% and the average is 99.70%. Half of all sellers received their full asking price or better, and the typical negotiation gap was less than one-third of one percent. Sellers who price homes accurately rarely have to come down. The 30% who did reduce their price averaged a $14,997 cut, showing buyers at this price point are doing their homework and won't overpay for a mispriced listing.
What is the price per square foot in Sterling Chase?
The median price per square foot in Sterling Chase is $244 based on above-grade finished living area, with an average of $239. That is well above Topeka's overall price per square foot, reflecting the neighborhood's newer construction and higher-end finishes. Homes with finished basements offer additional value that this metric doesn't fully capture.
Is there new construction in Sterling Chase?
Yes. Several homes sold in the past 24 months were built in 2024 or 2025, with new builds concentrated along Beaumont ST and Derby DR. New construction in Sterling Chase has generally closed in the $385,000 to $520,000 range. The continued development signals long-term confidence in the neighborhood and gives buyers a real choice between established resale homes and brand-new builds within the same community.
Are sellers offering closing cost assistance in Sterling Chase?
About 22% of Sterling Chase sellers offered closing cost help, with an average concession of $4,806 and a median of $5,000. That's a lower concession rate than in more affordable parts of Topeka, which reflects the stronger demand at this price point. It remains a normal part of negotiation in about one in five deals, so it's worth asking, especially on homes that have been sitting more than two weeks.
How often do sellers reduce their asking price in Sterling Chase?
About 30% of Sterling Chase homes had at least one price reduction before going under contract, with an average drop of $14,997. At $400,000 to $600,000, even a small percentage mispricing is a meaningful dollar amount, and buyers notice. Homes that start too high tend to sit visibly before a real correction is needed. For buyers who are flexible on timing, watching for reductions can occasionally surface good opportunities.
Sterling Chase Market Overview: What the Data Shows
Sterling Chase recorded 27 home sales over the past 24 months, with the median home trading at $480,000 and the average at $460,008. The neighborhood sits in the upper tier of the Topeka market, supported by newer construction, spacious ranch-style floor plans, and a desirable northwest location.
The market moves quickly for homes priced right. A 5-day median time on market and a 100% median list-to-sale ratio show that well-positioned homes find buyers fast and rarely have to negotiate down. The 30% of homes that needed price cuts and the handful that sat for 60 to 100+ days show this isn't a market where anything sells regardless of price. Buyers in the $400,000 to $600,000 range are informed and patient, and they reward sellers who price accurately from day one.
The broader story is one of steady, sustainable growth with rising momentum. Year-over-year median prices climbed 6.04%, average prices rose 7.49%, and sales volume jumped 45%. New construction continues to add inventory, keeping buyer interest fresh and broadening the neighborhood's long-term appeal.
Sterling Chase Pricing Trends and Year-Over-Year Analysis
Days on Market: Why the Gap Between Median and Average Matters
The median time on market is 5 days, while the average is 26.3 days. That gap is significant and tells an important story before you list or make an offer.
Most Sterling Chase homes sell fast. More than half went under contract within a week. A smaller group sat for 50, 80, or over 100 days, almost always because the initial list price was out of step with what the market would support. At this price point, getting the list price right matters more than in lower-priced neighborhoods because the dollar consequences of a mispricing are larger and buyers are more deliberate.
List-to-Sale Ratio and Pricing Discipline
The median list-to-sale ratio of 100% shows that pricing in Sterling Chase has generally been disciplined. Sellers are setting numbers buyers are willing to pay, and most deals close right at asking. The 30% of homes that needed a price cut averaged a $14,997 reduction. When a Sterling Chase home sits without offers, it's almost always a pricing issue, and the market corrects it decisively rather than gradually.
Year-Over-Year Snapshot: May 2024 through May 2026
Splitting the 24-month dataset into two 12-month windows shows clear upward momentum across both price and volume.
Most recent 12 months (May 7, 2025 – May 6, 2026): 16 sales | Median $490,450 | Average $473,451
Prior 12 months (May 7, 2024 – May 6, 2025): 11 sales | Median $462,500 | Average $440,454
The median price grew 6.04%, an increase of $27,950. The average rose 7.49%, adding $32,997. Sales volume jumped 45.45%, from 11 to 16 closings. Rising prices alongside rising volume is a strong signal: demand isn't just holding steady, it's expanding. Buyers are accepting higher prices to get into Sterling Chase, and more of them are competing to do so.
One honest note: with 27 total sales, Sterling Chase produces a smaller dataset than higher-volume Topeka neighborhoods. A single high or low outlier can move the numbers more here than it would in a 200-sale market. The direction is clear and consistent, but individual data points carry more weight in a smaller sample.
Seller Concessions: What to Expect at Closing
About 22% of Sterling Chase sellers contributed toward buyer closing costs, averaging $4,806 with a median of $5,000. That's a lower concession rate than more affordable Topeka neighborhoods, which reflects stronger demand at this price point. Buyers here tend to be financially prepared, and sellers don't have to give as much to close a deal. Still, roughly one in five transactions included a concession, so it remains a normal part of negotiation rather than a red flag.
Sterling Chase Home Styles: Prices and Market Speed by Type
| Home Style | Homes Sold | Average Price | Median Price | Avg. Days on Market | List-to-Sale Ratio |
|---|---|---|---|---|---|
| Ranch | 24 | $455,015 | $471,250 | 29.5 | 100.00% |
| Raised Ranch | 2 | $474,922 | $474,922 | 1.0 | 100.44% |
| 1.5 Story | 1 | $550,000 | $550,000 | 0.0 | 100.00% |
Ranch Homes: The Defining Style of Sterling Chase
Ranch homes are essentially the entire Sterling Chase market, accounting for 89% of all sales (24 of 27). The median ranch sold for $471,250 with an average of $455,015. The 29.5-day average time on market mirrors the broader neighborhood pattern: most ranches move in days, but a few longer-marketed homes pull that number up. Sterling Chase ranches span from older, smaller resale properties around $230,000 up to large modern new builds approaching $620,000, giving buyers real options across a meaningful price spectrum.
Raised Ranch Homes: Newer, Faster, and at a Slight Premium
Two raised ranches sold during the analysis period, averaging $474,922, approximately 1% above the median standard ranch. Both were new construction on Beaumont ST and both sold in about a day. The sample is small, but the speed and price confirm that newer raised ranch builds in Sterling Chase find buyers immediately when they hit the market.
1.5 Story: Rare but Strong
Only one 1.5-story home sold in the past 24 months, closing at $550,000, roughly $79,000 above the neighborhood median, and going under contract on the day it listed. Non-ranch styles are uncommon in Sterling Chase, and when they appear, they tend to move fast because the buyer pool for a unique floor plan in a desirable neighborhood is motivated.
What This Means for Sterling Chase Buyers and Sellers
If You're Selling in Sterling Chase
The data favors you, but execution matters. With a 100% median list-to-sale ratio and a 5-day median time on market, properly priced homes sell quickly and at full price. The 30% of sellers who needed price cuts overshot at the start, and at this price point, sitting on the market for 60+ days is expensive and signals weakness to buyers. A pre-listing review of recent comparable sales is the most important step you can take.
Budget for a possible concession. About one in five sellers contributed around $5,000 toward buyer closing costs. Presentation also matters here more than at lower price points. Buyers spending $450,000 to $600,000 expect homes to show well, and investing in fresh paint, landscaping, and professional photography consistently pays back at closing.
If You're Buying in Sterling Chase
Move fast on the right home. A 5-day median time on market means the homes that check your boxes don't wait around. Pre-approval is non-negotiable, and being ready to write a clean, competitive offer on day one is what wins here.
You have leverage on homes that have been sitting. If a listing is past the two-week mark without a contract, it's a candidate for real negotiation, possibly including both a price adjustment and closing cost assistance. The data shows 30% of homes took that path, so patience and preparation can pay off if your timeline is flexible.
If new construction appeals to you, Sterling Chase is still actively building along Beaumont ST and Derby DR. New builds give you the chance to get exactly what you want, but they tend to close at the top of the price range and rarely include meaningful discounts from the builder.
Sterling Chase Market Outlook: Looking Ahead
The combination of 6.04% year-over-year median price growth, 45% volume growth, and continued new construction points to a neighborhood with real momentum. Sterling Chase has the fundamentals that tend to support long-term appreciation: newer housing stock, strong demand for single-level living, a desirable northwest Topeka location, and a consistent buyer pool at the upper end of the market. The trajectory looks durable heading into the next 12 to 24 months.
Thinking About a Move in Sterling Chase? Let's Talk.
If you're considering selling: Get a free, no-obligation home valuation for your Sterling Chase home. We'll pull the most relevant comparable sales for your specific street and home style so you can price it right from day one.
If you're thinking about buying: Reach out for a relaxed conversation about what you're looking for. Whether you want move-in-ready new construction or an established home with character, we can set up a custom search and walk you through what's actually moving right now.
If you just have questions: No pressure, no pitch. Whether you're a year out from a move or just curious about your home's value, a quick conversation is free and usually worth it.
We're local, we know this market, and we'd rather help you make the right decision on your timeline than push you into one on ours.
Sterling Chase Structured Data Summary
Neighborhood: Sterling Chase
City, State: Topeka, Kansas
Analysis Period: June 7, 2024 – April 13, 2026
Total Closed Transactions: 27
Price Statistics:
- Median Sold Price: $480,000
- Average Sold Price: $460,008
- Minimum Sold Price: $230,000
- Maximum Sold Price: $612,500
- Median Price per Square Foot (above grade): $244
- Average Price per Square Foot (above grade): $239
Market Velocity:
- Median Days on Market: 5 days
- Average Days on Market: 26.3 days
Pricing Accuracy:
- Median List-to-Sale Price Ratio: 100.00%
- Average List-to-Sale Price Ratio: 99.70%
- Homes with Price Reductions: 8 of 27 (29.6%)
- Average Price Reduction Amount: $14,997
Seller Concessions:
- Sellers Offering Concessions: 6 of 27 (22.2%)
- Average Concession Amount: $4,806
- Median Concession Amount: $5,000
Year-Over-Year Comparison:
- Recent 12 Months (May 7, 2025 – May 6, 2026): 16 sales | Median $490,450 | Average $473,451
- Prior 12 Months (May 7, 2024 – May 6, 2025): 11 sales | Median $462,500 | Average $440,454
- Median Price Change: +6.04% (+$27,950)
- Average Price Change: +7.49% (+$32,997)
- Sales Volume Change: +45.45% (+5 sales)
Home Style Distribution:
- Ranch: 24 sales (88.9%) | Median $471,250 | Avg DOM 29.5 days
- Raised Ranch: 2 sales (7.4%) | Median $474,922 | Avg DOM 1.0 days
- 1.5 Story: 1 sale (3.7%) | Median $550,000 | Avg DOM 0.0 days
Construction Era:
- Year Built Range: 1999 – 2025
- Active new construction along Beaumont ST and Derby DR (2024–2025 builds)
- New construction price range: approximately $385,000 – $520,000
Market Characterization: Seller's market | Strong demand | Sustainable appreciation | Active new construction
