
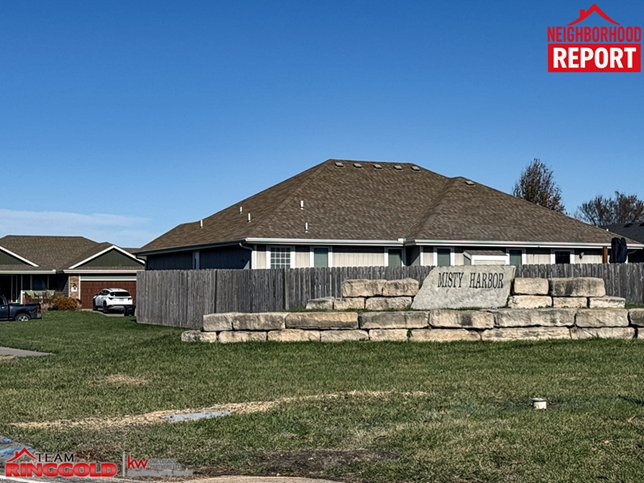
Quick Facts: Misty Harbor at a Glance
| Metric | Value | Context |
|---|---|---|
| Median Home Price | $360,000 | The midpoint of all 37 sales, representing the typical home value |
| Average Home Price | $375,887 | Pulled higher by newer and larger homes in the $450K+ range |
| Price Range | $250,000 – $539,900 | Wide range reflecting a mix of entry-level and higher-end homes |
| Average Days on Market | 41 days | Includes a few outlier listings that sat significantly longer |
| Median Days on Market | 13 days | Most well-priced homes sell in about two weeks |
| List-to-Sale Price Ratio | 98.53% | Buyers are negotiating roughly 1.5% off asking price on average |
| Price Per Square Foot | $222.75 | Based on above-grade finished living area |
| Year-Over-Year Median Price Change | -0.17% | Essentially flat, indicating a stable and balanced market |
| Total Sales Analyzed | 37 | Over a recent 24-month period |
Frequently Asked Questions About the Misty Harbor Real Estate Market
How much do homes cost in Misty Harbor?
Over the past 24 months, the median sold price in Misty Harbor was $360,000, with an average sold price of $375,887. The gap between those two numbers tells you something useful: most homes are clustered in the mid-$300K range, but a handful of larger or newer properties pushed the average higher.
The full range spans from $250,000 to $539,900, so there is real variety here. Entry-level homes (typically smaller ranches built in the early 2000s) start in the $280K-$320K range, while newer construction and homes with finished basements can push well into the $400Ks and above.
How long does it take to sell a home in Misty Harbor?
Here is where the numbers get interesting. The average days on market is 41 days, but the median is just 13 days. That is a big difference, and it matters. What it tells you is that most homes that are priced right are selling fast, typically within two weeks. But a few listings that were overpriced or had other challenges sat on the market much longer (some over 100 days), and those outliers dragged the average up considerably.
The takeaway? If your home is priced correctly for the Misty Harbor market, expect a reasonably quick sale. If it is overpriced, you could be waiting months.
Is Misty Harbor a seller's market or a buyer's market?
Based on recent data, Misty Harbor is best described as a balanced market with a slight lean toward buyers. Here is the evidence: 51.4% of homes sold below their asking price, while only 18.9% sold above asking. The list-to-sale ratio of 98.53% confirms that buyers are getting small but meaningful discounts.
That said, this is not a buyer's free-for-all. Well-priced homes are still moving quickly (median 13 days), and 29.7% of sales closed at full asking price. Sellers who price strategically from the start are doing fine. It is the overpriced listings that are struggling.
Are home prices increasing or decreasing in Misty Harbor?
Prices in Misty Harbor have been essentially flat year over year. The median price shifted by just -0.17% when comparing the earlier 12 months to the more recent period, and the average price dipped by about -3.49%. Neither of those numbers represents a meaningful decline.
What this really suggests is a market that has stabilized. After years of price increases across most of Topeka, Misty Harbor appears to have found a sustainable price level. Buyers are not overpaying, and sellers are not seeing their equity erode. It is a healthy sign for the neighborhood long-term.
What types of homes sell best in Misty Harbor?
Ranch-style homes dominate the Misty Harbor market, accounting for 73% of all sales (27 out of 37). This makes sense given the neighborhood's development patterns, which lean heavily toward single-story construction. Split-level homes make up 13.5% of sales, with 1.5-story and 2-story homes rounding out the remaining inventory.
In terms of pricing, split-level homes carry the highest average price at $397,350, which is about 5.3% more than the ranch average of $377,539. However, ranches sell at a strong list-to-sale ratio of 98.89% and represent by far the most liquid segment of the market.
Do homes in Misty Harbor sell for asking price?
It depends on the home and the pricing strategy. Looking at the data, 29.7% of homes sold at exactly their asking price, 18.9% sold above asking, and 51.4% sold below asking. The overall list-to-sale ratio of 98.53% means the typical buyer is negotiating about $5,000-$6,000 off a mid-range listing.
Homes that sold above asking tended to be well-priced from the start and went under contract quickly. The ones that sold below asking often had longer market times or had already gone through price reductions before receiving an offer.
What is the price per square foot in Misty Harbor?
The average price per square foot in Misty Harbor is $222.75, based on above-grade finished living area. This is a useful benchmark when comparing specific properties, but keep in mind that homes with significant finished basement space may show a lower per-square-foot cost when you factor in total livable area. Several homes in the dataset have 700 to 1,400+ square feet of finished below-grade space, which adds real value that the basic per-square-foot number does not fully capture.
Are sellers offering closing cost assistance in Misty Harbor?
About 18.9% of sellers offered some form of buyer concession during the analysis period. Among those who did, the average concession amount was $4,908. That is meaningful, potentially covering a significant portion of a buyer's closing costs.
The fact that roughly 4 out of 5 transactions involved no concessions tells you this is not standard practice in Misty Harbor. Concessions tend to show up more on homes that have been sitting on the market or where the seller needs a faster close. Buyers working with a good agent can identify these opportunities.
What's the best time to sell a home in Misty Harbor?
Looking at the quarterly sales patterns, Q1 and Q2 tend to see the most transaction volume. The first quarter of 2025 saw 8 sales and Q2 2025 saw 9 sales, the two busiest quarters in the dataset. Average prices have been fairly consistent across seasons, though Q4 2025 produced a notably strong average of $407,050.
For sellers, listing in late winter or early spring positions you to take advantage of the increased buyer activity that typically picks up in Q1 and carries through Q2. That said, well-priced homes in Misty Harbor have shown they can sell in any season.
How does Misty Harbor compare to other Topeka neighborhoods?
With a median price of $360,000 and homes built primarily between 2000 and 2023, Misty Harbor sits in the upper-middle tier of Topeka's residential market. The neighborhood features relatively newer construction compared to many established Topeka neighborhoods, with most homes under 25 years old. The combination of newer builds, consistent architectural styles, and a median time-to-sell of just 13 days suggests a neighborhood with strong demand and solid buyer confidence.
Have there been many price reductions in Misty Harbor?
About 29.7% of listings underwent at least one price reduction before selling. Among those that were reduced, the average cut was $27,873. That is a notable amount and reinforces why pricing strategy matters so much in this market.
The pattern is clear: homes that start at the right price sell quickly and close near or at asking. Homes that start too high end up chasing the market with reductions and often still sell below their adjusted asking price. If you are thinking about selling in Misty Harbor, the data makes a strong case for pricing competitively from day one.
Misty Harbor Market Overview
Over the past two years, Misty Harbor has recorded 37 residential sales, providing a solid dataset to understand what is really happening in this southwest Topeka neighborhood. The overall picture is one of stability and balance, which is frankly a good thing in a real estate market that has seen a lot of volatility in other parts of the country.
The median sold price of $360,000 and average of $375,887 position Misty Harbor as a neighborhood offering newer construction at price points that, while not entry-level for Topeka overall, represent solid value for the quality and age of the homes here. Most of the housing stock was built between 2003 and 2023, so buyers are getting relatively modern construction with updated systems and layouts.
Market speed tells two stories in Misty Harbor. The median days on market of 13 says that correctly priced homes move quickly. The average of 41 days says that mispriced homes can linger. This gap is one of the most important insights in the data, and we will dig into it more below.
The list-to-sale ratio of 98.53% signals a market where buyers have some negotiating room but are not extracting deep discounts. Sellers are retaining the vast majority of their asking price, which reflects a market that is functioning well for both sides.
Misty Harbor is a balanced market where pricing strategy matters more than timing. Well-priced homes sell quickly, while overpriced listings face extended market time and deeper negotiations.
Deeper Dive: What the Numbers Really Mean
Days on Market Analysis
The spread between the average (41 days) and median (13 days) days on market deserves some explanation, because it reveals a lot about how this market actually works.
The median is the middle value when you line up all 37 sales in order. It tells you that the typical home, the one right in the middle of the pack, sold in about two weeks. That is genuinely quick. It means more than half of all homes in Misty Harbor went under contract within 13 days of hitting the market.
The average, on the other hand, gets pulled up by outliers. Several homes sat on the market for 100+ days, including one that took 286 days and another at 176 days. These were generally homes that were either priced above what the market would bear or had specific challenges. When you average those long sits in with all the quick sales, you get 41 days, which paints a misleadingly slow picture.
For sellers: This data tells you that pricing is everything. If you price your Misty Harbor home correctly from the start, the market will respond quickly. If you test the waters with an aspirational price, you could be looking at months on market and an eventual sale at or below where you should have started.
For buyers: When a well-priced home hits the market in Misty Harbor, you need to be ready to act. The best values are not sitting around for weeks. Have your financing lined up, know what you want, and be prepared to write an offer within the first week.
Pricing Trends
The list-to-sale ratio of 98.53% is one of those numbers that sounds small but tells a real story. On a $360,000 home, a 1.47% discount works out to about $5,300 off asking price. That is meaningful for a buyer but not devastating for a seller.
Breaking down how homes sold relative to their asking price adds more texture. 29.7% of homes sold at full asking price, suggesting nearly a third of sellers got exactly what they wanted. Another 18.9% actually sold above asking, meaning some homes attracted competitive interest. But the largest group, 51.4%, sold below asking price, confirming that buyers do have some leverage in most transactions.
On the price reduction front, 29.7% of listings had at least one price cut before selling, with an average reduction of $27,873. That is not a trivial amount. It represents sellers who initially overshot and had to adjust. The smart play in this market is to price competitively from the beginning rather than start high and chase the market down.
Year-over-year, the median price has been virtually unchanged (-0.17%). This is actually a positive sign. It means Misty Harbor is not experiencing the kind of price correction that can rattle buyer confidence, but it also is not in an unsustainable growth phase that leads to affordability problems. The market has found its footing at a level that works.
Seller Concessions
18.9% of transactions included seller concessions, with an average concession of $4,908 among those deals. Concessions in real estate typically take the form of the seller covering a portion of the buyer's closing costs, and in Misty Harbor, they appear most often on homes that took longer to sell.
For buyers, this means concessions are not a given, but they are available in the right situations. If you are looking at a home that has been on the market for several weeks, there may be room to ask for closing cost help. For sellers, the data suggests that if your home is priced right and sells quickly, you are unlikely to need to offer concessions. It is the extended listings that tend to require sweeteners.
Comparative Analysis by Home Style
| Home Style | Homes Sold | Avg. Price | Median Price | Avg. Days on Market | List-to-Sale Ratio |
|---|---|---|---|---|---|
| Ranch | 27 | $377,539 | $359,900 | 41.7 | 98.89% |
| Split | 5 | $397,350 | $419,900 | 37.0 | 99.26% |
| 1.5 Story | 3 | $341,667 | $385,000 | 27.7 | 94.03% |
| 2 Story | 2 | $351,250 | $351,250 | 63.5 | 98.59% |
Ranch Homes (27 Sales, 73% of Market)
Ranch-style homes are the backbone of Misty Harbor, making up nearly three-quarters of all transactions. With an average price of $377,539 and a median of $359,900, they represent the core value proposition of the neighborhood. The list-to-sale ratio of 98.89% is the second-strongest among all styles, and the sheer volume of ranch sales means this is where you will find the most data points and the most reliable pricing comparisons.
Ranch homes in Misty Harbor appeal to a wide range of buyers, from young families to downsizers who prefer single-level living. The average days on market of 41.7 days tracks closely with the neighborhood average, though well-priced ranches routinely sell in under two weeks.
Split-Level Homes (5 Sales, 13.5% of Market)
Split-level homes are the premium segment of the Misty Harbor market. At an average price of $397,350, they are approximately 5.2% more expensive than ranch homes. The median of $419,900 is even more telling, sitting 16.7% above the ranch median. These homes also boast the best list-to-sale ratio in the neighborhood at 99.26%, meaning sellers are getting almost exactly what they ask for.
With an average of 37 days on market, splits move about 11% faster than the neighborhood average. The combination of strong pricing and quick sales suggests healthy demand for this home style in Misty Harbor.
1.5 Story Homes (3 Sales, 8.1% of Market)
With only 3 sales, the sample size here is small, so take these numbers with some caution. The average price of $341,667 makes 1.5-story homes approximately 9.5% less expensive than ranch homes on average. However, they posted the fastest average days on market at 27.7 days, about 33% quicker than the neighborhood average.
The list-to-sale ratio of 94.03% is notably lower than other styles, suggesting these particular homes required more negotiation. This could reflect the specific properties that sold rather than a broader trend about the style.
2 Story Homes (2 Sales, 5.4% of Market)
Two-story homes are the rarest style in Misty Harbor, with just 2 sales during the analysis period. The average price of $351,250 puts them between ranch and 1.5-story homes. The most notable data point is the average of 63.5 days on market, which is 54% longer than the neighborhood average. With such a small sample, it is hard to draw broad conclusions, but it suggests two-story homes may take longer to find the right buyer in this predominantly ranch-oriented neighborhood.
What This Means for You
If You're Selling in Misty Harbor
Price it right from day one. This is the single most important takeaway from the data. The 13-day median time to sell proves that correctly priced homes move fast. But the 29.7% of listings that needed price reductions, averaging nearly $28,000 in cuts, show what happens when you start too high. In a market where buyers are already negotiating about 1.5% off asking, adding a price reduction on top of that means leaving money on the table.
Concessions are a tool, not a requirement. Only about 1 in 5 transactions included seller concessions. If your home is priced correctly and shows well, you are unlikely to need them. But if your home has been on the market for more than 30 days, offering to cover some closing costs (around $5,000 based on the average) can be an effective way to generate renewed interest.
Presentation still matters. In a balanced market, buyers have choices. Your home needs to stand out among the competition, especially since ranch homes (the dominant style) create a lot of comparable options. Small investments in curb appeal, staging, and photography can make the difference between a 13-day sale and a 3-month listing.
If You're Buying in Misty Harbor
You have leverage, but not unlimited leverage. The 98.53% list-to-sale ratio means you can reasonably expect to negotiate $5,000 to $7,000 off a mid-range listing. But do not expect to lowball your way to a deal. Sellers in this market are holding firm on reasonable prices, and the homes that are priced right are selling quickly.
Be prepared to move fast on well-priced homes. With a median of 13 days on market, the best deals are not sitting around. Get your pre-approval in order before you start shopping. Know your budget, know what you want, and be ready to write an offer within a few days of seeing the right home.
Look at the full picture on older listings. Homes that have been sitting for 60+ days often represent the best negotiating opportunities. Several sales in the data show homes that eventually closed at 5-10% below their original asking price after extended market time. If you are flexible on timing and willing to negotiate, these can be real opportunities.
Do not skip the concession conversation. Nearly 1 in 5 sellers offered closing cost help. If you are buying a home that has been on the market for a while, it is worth asking. The average concession of $4,908 could meaningfully reduce your out-of-pocket costs at closing.
Looking Ahead
The Misty Harbor market is showing all the signs of a healthy, sustainable neighborhood. Prices have stabilized at levels that reflect the quality of the housing stock, homes are selling at a reasonable pace, and neither buyers nor sellers are being squeezed out of fair deals.
The neighborhood benefits from relatively newer construction (most homes built 2000-2023), which means lower maintenance costs and more modern floor plans compared to older Topeka neighborhoods. The strong concentration of ranch-style homes appeals to a broad buyer demographic, which should keep demand consistent.
Barring any significant shifts in mortgage rates or the broader Topeka economy, expect Misty Harbor to continue performing as a stable, well-regarded neighborhood with values that hold their ground. This is not the kind of market that creates overnight windfalls, but it is exactly the kind of market where homeownership builds steady, reliable equity over time.
Let's Talk About Your Misty Harbor Real Estate Goals
Thinking About Selling?
Pricing strategy is everything in this market, and the data proves it. I would love to prepare a personalized home valuation based on your specific property, its features, and how it compares to recent sales in the neighborhood. No obligation, no pressure. Just real data so you can make an informed decision about when and how to list.
Ready to Buy?
Whether you are looking at your first home in Misty Harbor or upgrading within the neighborhood, having a clear picture of current market conditions gives you a real advantage. Let me walk you through the latest inventory, help you understand what different price points get you, and build a strategy that fits your goals and your budget.
Just Have Questions?
Not everyone is ready to buy or sell right now, and that is perfectly fine. If you are curious about your home's current value, wondering about market trends, or just starting to think about your options, I am happy to chat. Reach out anytime for a no-pressure conversation about the Misty Harbor real estate market.
Structured Data Summary
City: Topeka
State: Kansas
Analysis Period: March 27, 2024 – February 27, 2026 (approximately 24 months)
Total Transactions: 37
--- Price Statistics ---
Median Sold Price: $360,000
Average Sold Price: $375,887
Minimum Sold Price: $250,000
Maximum Sold Price: $539,900
Average Price Per Square Foot (Above Grade): $222.75
--- Market Velocity ---
Average Days on Market: 41 days
Median Days on Market: 13 days
--- Pricing Accuracy ---
Average List-to-Sale Ratio: 98.53%
Sold Above Asking: 7 sales (18.9%)
Sold at Asking: 11 sales (29.7%)
Sold Below Asking: 19 sales (51.4%)
Listings with Price Reductions: 11 (29.7%)
Average Price Reduction Amount: $27,873
--- Seller Concessions ---
Transactions with Concessions: 7 (18.9%)
Average Concession Amount: $4,908
--- Year-Over-Year Comparison ---
Period 1 (March 2024 – February 2025): 14 sales, median $360,500, average $384,229, avg DOM 43.9
Period 2 (March 2025 – February 2026): 23 sales, median $359,900, average $370,809, avg DOM 39.4
Median Price Change: -0.17%
Average Price Change: -3.49%
DOM Change: -10.3% (faster sales in recent period)
--- Home Style Distribution ---
Ranch: 27 sales (73.0%) | Avg $377,539 | Median $359,900 | DOM 41.7 | LTS 98.89%
Split: 5 sales (13.5%) | Avg $397,350 | Median $419,900 | DOM 37.0 | LTS 99.26%
1.5 Story: 3 sales (8.1%) | Avg $341,667 | Median $385,000 | DOM 27.7 | LTS 94.03%
2 Story: 2 sales (5.4%) | Avg $351,250 | Median $351,250 | DOM 63.5 | LTS 98.59%
