
Quick Facts: Indian Hills Real Estate Market
| Metric | Value | Context |
|---|---|---|
| Median Sold Price | $253,000 | Best single benchmark for typical sale value |
| Average Sold Price | $266,324 | Pulled upward by a small cluster of premium sales |
| Price Range | $170,000 – $435,950 | Wide spread reflecting varied home sizes and styles |
| Median Days on Market | 5 days | Most well-priced homes move in under a week |
| Average Days on Market | 16.4 days | Elevated by a handful of overpriced or harder-to-sell listings |
| Median List-to-Sale Ratio | 100.0% | The typical home sells right at asking price |
| Average List-to-Sale Ratio | 100.17% | Buyers are paying at or slightly above list on average |
| Median Price Per Sq Ft | $213.64 | Based on above-grade finished area |
| Year-Over-Year Median Change | −8.1% | Median fell $21,250; Year 1 baseline was elevated by premium sales |
| Seller Concessions | 26.1% of sales | Avg $4,721 when offered; buyers have some leverage to ask |
| Total Sales in Period | 69 | Closed transactions, March 2024 through February 2026 |
Frequently Asked Questions About Indian Hills Real Estate
How much do homes cost in Indian Hills?
Over the past two years, the median sold price in Indian Hills has been $253,000, and the average sold price has been $266,324. The gap between those two numbers is worth understanding: a handful of higher-end ranch homes on SW Blue Stem Drive pulled the average up, so the median is the more reliable number for most buyers or sellers thinking about typical value in this neighborhood.
The full price range ran from $170,000 to $435,950, which reflects genuine variation in home size, condition, and style. Most of the activity clusters between $200,000 and $320,000.
How long does it take to sell a home in Indian Hills?
The median days on market over the recent two-year period was just 5 days, meaning more than half of all homes that sold did so in less than a week. That tells you well-priced homes don't sit. The average of 16.4 days is higher because a small number of listings took considerably longer, usually homes that started overpriced and needed a reduction before finding a buyer.
If your home is priced right from day one, Indian Hills is not a market where you wait around.
Is Indian Hills a seller's market or buyer's market?
Based on recent data, Indian Hills leans toward a seller-favorable market, though it's more balanced than it was a few years ago. The median list-to-sale ratio of 100% means the typical home sells for exactly what it's listed at, and sellers are not broadly making large concessions. Homes move quickly when priced correctly.
That said, buyers do have some room to work with. About 26% of sellers offered concessions over this period, and roughly 19% of homes had their price reduced before selling. If a home has been sitting or has taken a price cut, buyers have more room to negotiate than the headline numbers suggest.
Are home prices increasing or decreasing in Indian Hills?
The data shows a year-over-year softening in prices. The median sold price dropped from $261,250 in Year 1 (March 2024 through February 2025) to $240,000 in Year 2 (March 2025 through February 2026), a decrease of $21,250 or about 8.1%. The average sold price fell from $272,254 to $259,855, a drop of $12,398 or 4.6%.
There's important context here: three premium homes on SW Blue Stem Drive sold in Year 1 at $395,000 to $435,950, which elevated that year's baseline. Without those sales, the year-over-year decline in the broader neighborhood looks closer to 5%. Either way, prices have cooled modestly, which is consistent with broader market trends in the region. This is a correction, not a collapse.
What types of homes sell in Indian Hills?
Indian Hills is a ranch-heavy neighborhood. Ranch-style homes make up 64% of all sales (44 out of 69), and they command the highest prices with a median sold price of $275,000. Bi-level homes are the second most common style at 22% of sales, with a median of $235,000. Splits, 1.5-story, and a single two-story home make up the rest.
If you're looking for the most options in Indian Hills, ranch homes are where the inventory is. If you're budget-conscious, bi-levels offer solid value at a meaningful discount to ranches.
Do homes in Indian Hills sell for asking price?
Yes, typically. The median list-to-sale ratio is exactly 100%, and the average is 100.17%. That means the typical home closes right at asking price, and on average buyers are paying just a hair above list. You'll see some homes sell over list and some under, but the market isn't routinely producing large bidding wars or deep discounts.
About 18.8% of homes did have a price reduction before selling, and those averaged a reduction of about $21,085. Those are the listings where buyers may have been able to negotiate a bit. For homes that went under contract quickly with no price cut, sellers generally held firm on price.
Are sellers offering closing cost assistance in Indian Hills?
About 26% of sellers offered some form of closing cost assistance or seller participation during the analysis period. When sellers did offer concessions, the average amount was $4,721. That's not nothing, but it's also not a buyer's market where concessions are expected on every deal.
The fact that roughly one in four sellers is offering some help suggests buyers have a reasonable shot at asking for concessions, especially on homes that have been listed for a while or have taken a price cut. Don't expect it as a given, but it's worth asking.
What is the price per square foot in Indian Hills?
The median price per square foot in Indian Hills is $213.64 (based on above-grade finished area). The average is $211.73, which is close enough that the two measures tell a consistent story. For context, this is a solid mid-tier value for Topeka's west side, reflecting well-maintained, established homes with strong usability.
There's variation by style: bi-levels actually run a bit higher at around $217 per square foot because their footprint is smaller relative to price, while 1.5-story homes come in lower at around $172 per square foot partly due to their larger size pulling the per-foot cost down.
How have Indian Hills home prices changed over the past year?
Comparing the two 12-month periods in this analysis, prices declined. In the first year (March 2024 through February 2025), the median sold price was $261,250 and the average was $272,254. In the second year (March 2025 through February 2026), the median dropped to $240,000 and the average to $259,855.
That's a median decline of $21,250 (-8.1%) and an average decline of $12,398 (-4.6%). Sales volume also ticked down slightly, from 36 transactions in Year 1 to 33 in Year 2. Some of the Year 1 elevation is attributable to three high-end Blue Stem Drive sales that aren't really representative of the broader neighborhood. Adjusted for that, the underlying softening is more modest but still real. This is a market finding a new level, not one in freefall.
How does Indian Hills compare to other Topeka neighborhoods?
Indian Hills sits in the middle-to-upper range of Topeka's established west-side neighborhoods. At a median of $253,000, it's priced above many older neighborhoods closer to downtown, but below newer subdivisions in the far southwest. The combination of quick sale times, a 100% list-to-sale ratio, and a predominance of ranch homes gives it broad appeal for move-up buyers and those looking for single-level living without going to the newest construction.
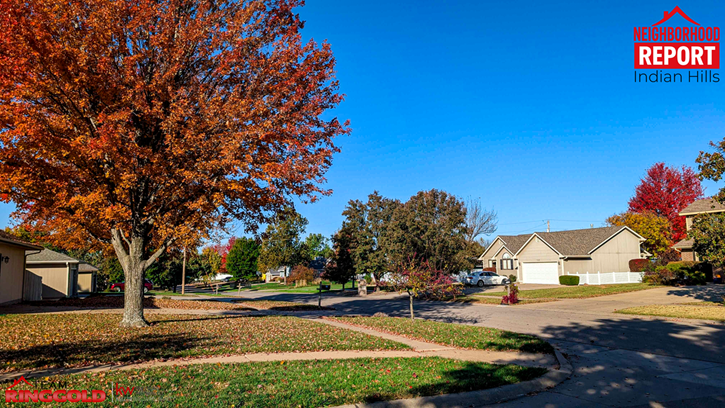
The neighborhood's street network, mix of mature lots, and proximity to west Topeka amenities tend to attract buyers who want a settled, livable neighborhood rather than cutting-edge new builds.
Is Indian Hills a good place to buy a home right now?
If you're looking for an established ranch neighborhood on Topeka's west side with solid fundamentals, Indian Hills has a lot going for it. Prices have softened slightly from their recent peak, which gives buyers modestly better positioning than a year ago. Homes still move fast when priced right, so you need to be ready to act, but the market isn't so frenzied that buyers have zero leverage.
Whether it's a good time to buy always depends on your own situation more than market timing. What the data does show is that Indian Hills is a functioning, active neighborhood with consistent demand and a genuine track record of homes selling at or near full price.
Market Overview
Indian Hills is a well-established west Topeka neighborhood dominated by ranch-style homes, and over the past two years it's behaved like a market that knows its own value. Sixty-nine homes closed between March 2024 and February 2026, with a median sold price of $253,000 and an average of $266,324. The gap between those two figures reflects a small cluster of premium homes at the top of the price range, but the core of the market runs from roughly $200,000 to $320,000.
Market speed is one of Indian Hills' standout characteristics. The median days on market was just 5 days, and homes that sold quickly tended to sell at or above asking price. The median list-to-sale ratio of exactly 100% confirms this isn't a market where buyers routinely negotiate below list. At the same time, about 19% of homes took a price reduction before selling, and roughly a quarter of sellers offered closing cost assistance. The picture that emerges is a market that rewards accurate pricing and where buyers have real but limited leverage.
Year-over-year, prices softened. The median fell from $261,250 in the first 12 months to $240,000 in the second, and average prices dropped from $272,254 to $259,855. Some of that decline reflects the presence of three high-end ranch sales on SW Blue Stem Drive in Year 1 that inflated the prior-year baseline, but the softening is genuine across the broader neighborhood as well. Overall, this is a stable, active market going through a modest price correction consistent with what's happening in many established Topeka neighborhoods.
Deeper Dive Analysis
Days on Market: What the Numbers Actually Mean
There's always a difference between the median and average days on market, and Indian Hills makes that gap easy to explain. The median of 5 days tells you what most homes experience: they hit the market, get showings, and go under contract fast. The average of 16.4 days is higher because a handful of outlier listings took 80, 90, or even 130+ days to sell, which pulls the average up.
For sellers, this means pricing strategy matters more than almost anything else. Homes that are priced right don't wait. Homes that are priced aspirationally tend to sit, eventually take a price cut, and end up selling for less than they would have at an honest price from day one. The data here supports a price-to-the-market strategy, not a let's-see-what-we-can-get approach.
For buyers, the 5-day median means you need to be ready. Pre-approval in hand, agent on speed dial, and a willingness to make a decision quickly on anything that genuinely fits your needs. If a home has been sitting for a month or more in this neighborhood, that's a signal worth paying attention to.
Pricing Trends
The median list-to-sale ratio of 100% (average 100.17%) is a strong indicator of a healthy, functioning market. Buyers aren't routinely overpaying, and sellers aren't routinely cutting. When the average exceeds 100%, it means some homes are drawing multiple offers and closing above list, which did happen here, particularly on well-presented homes in the $220,000-$270,000 range.
About 18.8% of homes had their original asking price reduced before selling, with an average reduction of $21,085. That's not a trivial number -- it suggests sellers who got aggressive on pricing paid for it. The market was willing to reward appropriately priced homes and punish overpriced ones.
Year-Over-Year Snapshot
This is the most important trend to understand in the current Indian Hills market. Comparing the two 12-month periods within the analysis window:
- Median price: Fell from $261,250 (Year 1) to $240,000 (Year 2) — a decline of $21,250 (-8.1%)
- Average price: Fell from $272,254 (Year 1) to $259,855 (Year 2) — a decline of $12,398 (-4.6%)
- Sales volume: Dropped from 36 transactions (Year 1) to 33 (Year 2) — a decrease of 3 sales (-8.3%)
The three Blue Stem Drive sales, all in Year 1, are part of this story. Without them, Year 1's median was approximately $253,000, making the year-over-year decline closer to 5% rather than 8%. Either way, Indian Hills experienced a real but modest price softening in the most recent 12-month period, consistent with broader affordability pressures affecting many established Topeka neighborhoods.
Seller Concessions
Eighteen of 69 sales (26.1%) included some form of seller concession, with an average of $4,721 when offered. That's a meaningful share of transactions, and it tells you that buyers are asking for help with closing costs and getting it on roughly one in four deals.
This is a useful data point for buyers to know: concessions are not a given, but they're not uncommon either. The sellers who are offering them are generally doing so to get a deal done, often on homes that aren't generating the competitive interest they hoped for. On a home with strong demand that goes under contract quickly, expecting a concession is probably not realistic.
Home Style Comparison
| Home Style | Homes Sold | Average Price | Median Price | Avg. Days on Market | List-to-Sale Ratio |
|---|---|---|---|---|---|
| Ranch | 44 | $275,735 | $275,000 | 14 days | 100.1% |
| Bi-Level | 15 | $232,267 | $235,000 | 12 days | 101.2% |
| Split | 5 | $253,100 | $253,000 | 20 days | 100.3% |
| 1.5 Story | 4 | $309,250 | $307,250 | 64 days | 97.5% |
| 2 Story | 1 | $257,500 | $257,500 | 1 day | 100.0% |
Ranch Homes
Ranch homes are the backbone of Indian Hills, accounting for 64% of all sales. With a median sold price of $275,000, they command the highest prices in the neighborhood and sell at essentially full asking price (100.1% list-to-sale ratio). The average days on market of 14 days is respectable, though it's pulled up by a few longer-running listings. Ranch homes here range from modest single-level layouts in the low $200s to larger, well-appointed homes approaching $400,000. They attract a wide range of buyers including retirees and move-down buyers seeking single-level living, which keeps demand consistently solid.
Bi-Level Homes
Bi-levels are Indian Hills' value play. At a median of $235,000, they're approximately $40,000 less expensive than the median ranch home, making them appealing for first-time buyers and those stretching their budget on the west side. Interestingly, bi-levels had the highest average list-to-sale ratio in the neighborhood at 101.2%, meaning on average they closed slightly above asking price. This points to genuine demand for this price segment. They also moved reasonably fast at an average of 12 days on market.
Split-Level Homes
With just five sales, split-level data should be taken with some caution, but the numbers are solid: a median of $253,000, a 100.3% list-to-sale ratio, and a median days on market of just 4 days. Splits occupy the middle ground between bi-levels and ranches on price, and the quick sale times suggest buyers who want them are motivated. The average days of 20 is skewed by one slower sale; most went under contract quickly.
1.5-Story Homes
The 1.5-story homes in Indian Hills are the highest-priced segment outside the premium Blue Stem Drive ranches, with a median of $307,250. That's about $72,000 more than the typical bi-level and $32,000 more than the typical ranch. However, they take considerably longer to sell -- an average of 64 days on market -- and the 97.5% list-to-sale ratio suggests buyers are negotiating these homes below ask. With only four sales, this is a limited dataset, but the pattern is consistent: larger, higher-priced homes in established neighborhoods attract a narrower pool of buyers and require patience.
What This Means for You
If You're Selling in Indian Hills
Price it right the first time. This is the single biggest takeaway from the data. The median days on market is 5 days for homes that sell well, and the list-to-sale ratio is right at 100%. Homes that are priced accurately go fast and close at asking. Homes that are overpriced sit, take price cuts, and often end up selling for less than a well-priced listing would have gotten from the start.
Presentation still matters. Even in a market with healthy demand, buyers have choices. Clean, well-maintained homes in good repair will attract the buyers who make quick, confident offers. Deferred maintenance or cosmetic issues give hesitant buyers an excuse to wait or negotiate down.
Expect concession conversations. About one in four sellers in this market contributed to closing costs. If you're selling a home where the buyer pool skews toward people who need help with upfront costs, be prepared for that conversation. Building some flexibility into your pricing strategy is smarter than being caught off guard at the negotiating table.
Year-over-year context: Prices softened in the most recent 12-month period. This isn't a reason to panic, but it's a reason to be realistic. If you're anchoring your price expectations to what a neighbor sold for a year or two ago, you may need to adjust your thinking.
If You're Buying in Indian Hills
Move quickly on well-priced homes. A 5-day median means that if you find a home you love that's priced right, you're probably not the only one looking at it. Have your pre-approval current, know your numbers, and be ready to write a clean offer without unnecessary contingencies slowing you down.
Concessions are worth asking for. About a quarter of transactions included seller participation. This is especially worth exploring on homes that have had a price reduction or have been sitting for more than two to three weeks. The market average concession was around $4,700, which can meaningfully offset your closing costs.
Ranch homes are the dominant product. If ranch-style living is what you're after, Indian Hills has depth. The bi-level segment offers meaningful savings -- roughly $40,000 less than the typical ranch -- if the floor plan works for you. Don't dismiss them based on style alone; the list-to-sale data suggests buyers in that price range are competitive.
Watch for homes with price reductions. About 19% of homes here took a price cut before selling. Those situations often represent sellers who are now motivated and realistic. Buyers who are patient and attentive can find opportunities in that segment of the market.
Looking Ahead
Indian Hills has the fundamentals that keep established neighborhoods relevant over time: a dominant product type (ranch homes) with broad buyer appeal, a price point that's accessible relative to newer construction, and a track record of quick sales when homes are appropriately priced. The modest price softening in the most recent 12 months reflects macro conditions more than anything specific to the neighborhood.
Demand for single-level living in established west Topeka neighborhoods isn't going away. As the buyer pool for newer construction faces affordability constraints, well-maintained homes in neighborhoods like Indian Hills become more attractive. The key word is well-maintained -- buyers in this market are making significant purchases and they expect homes to reflect their price.
Ready to Talk About Your Indian Hills Home?
Thinking about selling? The data is clear that pricing strategy makes or breaks outcomes in this market. I can walk you through a current market analysis specific to your home's style, size, and condition so you know exactly where you stand before you list. No pressure, just numbers.
Looking to buy? Indian Hills moves fast. If you want to be competitive in this neighborhood, it helps to have someone who knows the inventory and can move quickly when the right home comes up. Let's talk about what you're looking for and what realistic expectations look like right now.
Just curious? That's fine too. If you're a homeowner in Indian Hills wondering what your home is worth in this market, I'm happy to give you an honest read -- no sales pitch required. Knowing your equity position is just good financial hygiene.
Reach out whenever you're ready. There's no wrong time to get good information.
Structured Data Summary
Neighborhood: Indian Hills
City: Topeka
State: Kansas
Analysis Period: March 1, 2024 – February 28, 2026
Total Closed Transactions: 69
PRICE METRICS
Median Sold Price: $253,000
Average Sold Price: $266,324
Minimum Sold Price: $170,000
Maximum Sold Price: $435,950
Median Price Per Square Foot (above grade): $213.64
Average Price Per Square Foot (above grade): $211.73
MARKET VELOCITY
Median Days on Market: 5 days
Average Days on Market: 16.4 days
PRICING ACCURACY
Median List-to-Sale Ratio: 100.00%
Average List-to-Sale Ratio: 100.17%
Homes with Price Reductions: 13 (18.8% of sales)
Average Price Reduction Amount: $21,085
SELLER CONCESSIONS
Sales with Seller Participation: 18 (26.1%)
Average Concession When Offered: $4,721
YEAR-OVER-YEAR COMPARISON
Year 1 (March 2024 – February 2025): 36 sales | Median $261,250 | Average $272,254
Year 2 (March 2025 – February 2026): 33 sales | Median $240,000 | Average $259,855
Median Price Change: −$21,250 (−8.1%)
Average Price Change: −$12,398 (−4.6%)
Sales Volume Change: −3 transactions (−8.3%)
Note: Three premium Ranch homes on SW Blue Stem Drive closed in Year 1 at $395,000–$435,950, elevating the Year 1 baseline. Excluding these, the year-over-year median decline is approximately 5.1%.
HOME STYLE DISTRIBUTION
Ranch: 44 sales (63.8%) | Median $275,000 | Avg $275,735 | Avg DOM 14 days | L/S 100.1%
Bi-Level: 15 sales (21.7%) | Median $235,000 | Avg $232,267 | Avg DOM 12 days | L/S 101.2%
Split: 5 sales (7.2%) | Median $253,000 | Avg $253,100 | Avg DOM 20 days | L/S 100.3%
1.5 Story: 4 sales (5.8%) | Median $307,250 | Avg $309,250 | Avg DOM 64 days | L/S 97.5%
2 Story: 1 sale (1.4%) | Median $257,500 | Avg $257,500 | Avg DOM 1 day | L/S 100.0%
DATA NOTE: One additional sale (2325 SW Romar RD, closed March 19, 2026 at $259,000) was excluded from this analysis as it fell outside the March 1, 2024 – February 28, 2026 report window. Five additional listings appearing in the source data were Active or Under Contract at time of export and were not included in sold metrics.
