
West Hills & Cedar Crest Market Quick Facts
| Metric | Value | What It Means |
|---|---|---|
| Median Sold Price | $324,700 | The middle price point across 17 standard sales; less influenced by outliers |
| Average Sold Price | $344,565 | Pulled higher by larger ranch and 1.5-story homes in the $410K–$460K range |
| Price Range | $245,000 – $460,000 | Broad price spectrum; entry-level splits at lower end, large ranches at upper end |
| Median Days on Market | 4 days | More than half of homes go under contract within four days of listing |
| Average Days on Market | 12.5 days | Two heavily discounted outliers (44 and 67 days) pull the average up significantly |
| List-to-Sale Ratio | 99.09% | Well-priced homes sell at or very close to asking; some styles sell over ask |
| Price Per Sq Ft (Above Grade) | $153.78 | Reflects the neighborhood's blend of mid-century ranches and larger two-story homes |
| Year-Over-Year Median Price | –3.1% ($–10,300) | Modest softening; small sample size and mix-shift in home types are likely factors |
| Seller Concession Rate | 35.3% of sales | When offered, average concession was $9,181; buyers have modest negotiating room |
| Total Standard Sales Analyzed | 17 sales | Plus 3 off-market / Sold Before Process MLS transactions (disclosed below) |
West Hills & Cedar Crest Real Estate Market Overview
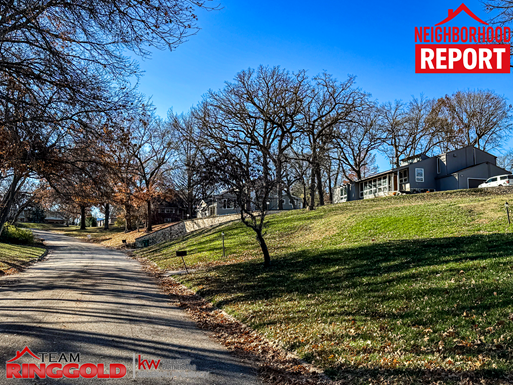
West Hills and Cedar Crest are among Topeka's most established and sought-after southwest neighborhoods. Defined by mature trees, generous lot sizes averaging over half an acre, and mid-century ranch architecture that has aged gracefully, these neighborhoods attract buyers who want character, space, and proximity to Washburn University and the southwestern corridor's amenities.
Over the past two years, the market here has recorded 17 standard MLS sales, with sold prices spanning $245,000 to $460,000 and a median of $324,700. That range reflects real diversity in the housing stock—from updated split-level homes in the low $200s to expansive ranches with 2,800-plus square feet pushing toward the mid-$400s.
Market velocity is the headline story. The median days on market is just 4 days, and the average list-to-sale ratio sits at 99.09%. The typical well-priced home in West Hills and Cedar Crest does not linger. It finds a buyer quickly and sells close to—or sometimes above—the asking price. That is the behavior of a neighborhood with genuine demand and limited supply, not a neighborhood coasting on momentum.
Year-over-year, the median price showed a modest pullback of 3.1%, moving from $335,000 in the earlier 12-month period to $324,700 more recently. That dip is worth understanding in context: the sample is small (8 vs. 9 sales between the two periods), and the mix of home types sold shifted slightly. This is not a signal of price deterioration—it's the natural variance you'd expect in a low-volume, high-character neighborhood where no two homes are identical.
West Hills & Cedar Crest Real Estate: Frequently Asked Questions
How much do homes cost in West Hills and Cedar Crest in Topeka?
Based on recent market data, the median sold price in West Hills and Cedar Crest is $324,700, with an average of $344,565 across 17 standard MLS transactions over the past two years. The price range runs from $245,000 on the lower end to $460,000 at the top of the market.
That spread reflects the genuine variety in the housing stock here. Smaller split-level homes and bi-levels in the upper $200s represent the entry point, while larger ranches with substantial finished square footage—think 2,800-plus above grade—push toward $450,000 and above. Most buyers should plan their search in the $280,000-to-$360,000 range for a well-maintained ranch with three bedrooms and two baths.
How fast do homes sell in West Hills and Cedar Crest?
The median days on market is 4 days—meaning more than half of all homes in this neighborhood go under contract within four days of hitting the MLS. That is a meaningful signal of how competitive demand is relative to available inventory.
The average of 12.5 days tells a different story only because two heavily discounted properties—one listed at $548,000 and one at $335,000 after reductions, both of which sat longer while the market gave feedback on pricing—pull that figure upward. If a home is priced correctly from day one, buyers in this neighborhood move fast. Buyers who want to compete here need to be pre-approved and ready to act.
Is West Hills and Cedar Crest a seller's market or a buyer's market?
West Hills and Cedar Crest leans seller-favorable, particularly for correctly priced homes. A 99.09% average list-to-sale ratio and a 4-day median days on market both point to a market where sellers retain pricing power and buyers have limited ability to negotiate on well-positioned listings.
That said, there is nuance. About 35% of sellers offered concessions averaging $9,181—primarily covering buyer closing costs or rate buydowns—and roughly 24% of homes saw price reductions before going under contract. Buyers are not without leverage, especially on homes that have sat for more than two weeks. The market rewards sellers who price strategically and buyers who move decisively.
What types of homes sell in West Hills and Cedar Crest?
Ranch-style homes dominate this market, representing nearly 59% of all standard sales over the recent two-year period. That's 10 out of 17 standard transactions, making the ranch by far the most prevalent style. They range widely in size and price—from modest 1,600-square-foot homes in the $270s to expansive 4,700-square-foot ranches exceeding $400,000.
Beyond ranches, the neighborhood includes 1.5-story homes (2 sales, averaging $450,000), 2-story homes (2 sales, averaging $317,500), splits (2 sales, averaging $297,500), and at least one bi-level. The mid-century character of West Hills and Cedar Crest means most of the housing stock dates from the 1940s through the 1970s, with a few notable exceptions built in the 1980s and 1990s.
Do homes in West Hills and Cedar Crest sell for their asking price?
On average, homes sell at 99.09% of their asking price—essentially at asking, and in some cases above it. Split-level homes actually averaged 101.1% of list price over the past two years, meaning buyers competed above ask for that style. Ranch homes averaged 99.4% of list.
The caveat is homes that required price corrections. Four properties entered the market and needed at least one price reduction before going under contract, with average reductions of $42,650. Those homes sold at a steeper discount to their final asking price, dragging the average slightly below 100%. The lesson is consistent: accurate initial pricing produces faster sales and better returns. Overpriced listings are the exception, not the norm, but they do happen in this neighborhood.
Are sellers in West Hills and Cedar Crest offering closing cost assistance?
About 35% of sellers offered concessions in recent sales, with an average payout of $9,181 when concessions were part of the deal. In practice, this means roughly one in three buyers negotiated some form of seller-paid closing costs or rate assistance.
That rate suggests the market is balanced enough that buyers can ask, but not so slow that sellers feel obligated to offer. Buyers financing with conventional or FHA loans who need help covering closing costs have had reasonable success requesting assistance on homes that had some days on market. On fresh listings in the first week, sellers have less incentive to concede.
How have West Hills and Cedar Crest home prices changed over the past year?
Comparing the earlier 12-month period (July 2024 through June 17, 2025) to the most recent 12 months (June 18, 2025 through June 2026), median sold prices moved from $335,000 to $324,700—a decrease of $10,300, or approximately 3.1%. Average prices moved from $356,250 to $334,178, a decline of $22,072, or about 6.2%. Sales volume ticked up modestly, from 8 to 9 standard transactions.
Context matters here: with only 8 and 9 sales in each period, the apparent price movement is sensitive to which specific homes happened to sell when. The more recent period included proportionally more mid-range ranch sales and fewer high-end transactions, which naturally shifts the average and median downward even if underlying values are holding steady. Demand fundamentals—fast sales, near-full-price offers—remain intact. This does not read as a market in decline; it reads as a small-sample shift in the mix of homes that transacted.
How does West Hills and Cedar Crest compare to other Topeka neighborhoods?
West Hills and Cedar Crest sit above the Topeka average in both price and lot size, positioning them as one of the city's premium southwest corridor addresses. The $324,700 median price is meaningfully above the broader Topeka market, and lot sizes here averaging over half an acre are substantially larger than comparable mid-century neighborhoods closer to downtown.
Compared to neighboring areas like Indian Hills and Cherry Creek, West Hills and Cedar Crest tend to offer more mature landscaping, larger lots, and a slightly higher price ceiling. The mid-century ranch architecture that defines much of this area has strong and sustained appeal among buyers looking for character that newer construction can't replicate. For buyers comparing options in southwest Topeka, this neighborhood consistently competes on quality of place.
What is the price per square foot in West Hills and Cedar Crest?
The average price per above-grade square foot is $153.78, with a median of $152.84. These figures reflect above-grade finished area only, consistent with standard MLS measurement practices. Homes with substantial finished basements—several properties here have 900-plus square feet below grade—represent even stronger value on a total-finished-area basis.
Price per square foot varies meaningfully by home style and configuration. Smaller homes with higher-end finishes may push above $160 per square foot, while larger ranches with unfinished basements or deferred maintenance may come in below $140. Square footage alone is not the whole picture in a neighborhood where lot size, setting, and condition each carry real weight in buyer decisions.
What is a West Hills and Cedar Crest home?
West Hills and Cedar Crest are established southwest Topeka residential neighborhoods characterized by mid-century ranch homes, generous lots, and mature tree canopy. Most of the housing stock was built between the 1940s and 1970s, with streets like Cedar Crest Road, Brentwood Road, Yorkshire Road, Fairlawn Road, and Woodbury Lane forming the neighborhood's core. The area sits in close proximity to Washburn University's campus and offers convenient access to Wanamaker Road's retail corridor.
These neighborhoods attract buyers who value settled, established communities with architectural character over cookie-cutter new construction. Homes here tend to be owner-occupied long-term, which contributes to the low inventory and competitive conditions when properties do come to market.
West Hills & Cedar Crest Market: Deeper Dive Analysis
Days on Market: What the Numbers Actually Say
The gap between the 4-day median and the 12.5-day average in West Hills and Cedar Crest is not a data anomaly—it's a story about how pricing accuracy plays out in real time. When the median and average diverge this sharply, it almost always means a small number of properties sat much longer than the typical sale, pulling the mean upward while the majority of homes moved quickly.
In this dataset, two properties account for that divergence. One ranch on Whitehall Lane entered the market at $625,000, saw multiple price reductions to $548,000, and eventually closed at $460,000 after 67 days. A second ranch on Cedar Crest Road came in at $335,000, reduced to $299,900, and sold at $292,000 after 44 days. Both were initially priced above what the market would bear. Once pricing aligned, buyers engaged. Remove these two, and the remaining 15 standard sales averaged just 4.4 days—essentially the same as the median.
The practical takeaway for sellers: West Hills and Cedar Crest buyers know the market, and overpricing a home here does not produce bidding wars—it produces prolonged listings and eventual discounts. The homes that priced accurately sold within days and often at or above ask.
Pricing Trends in West Hills and Cedar Crest
The 99.09% average list-to-sale ratio tells a story of market equilibrium. Sellers are generally pricing homes close to what buyers will pay, and buyers are generally meeting them there. Five homes in this dataset actually sold above their asking price—all were either splits or ranches priced in the $270,000-to-$320,000 range that attracted multiple-offer scenarios.
Price reductions affected about 24% of homes in the period. That's not alarming in a market of this size—roughly one in four sellers tested the market above fair value, received feedback, and adjusted. The average reduction was $42,650 when it happened, which suggests sellers who miscalibrate tend to overshoot by meaningful amounts. The outlier on Whitehall Lane (listed at $625,000, sold at $460,000) accounts for a disproportionate share of that average reduction figure.
Year-Over-Year Snapshot: July 2024–June 2025 vs. June 2025–June 2026
Comparing the two 12-month periods within this data window:
- Median sold price: $335,000 (period 1) vs. $324,700 (period 2) — a decrease of $10,300, or –3.1%
- Average sold price: $356,250 (period 1) vs. $334,178 (period 2) — a decrease of $22,072, or –6.2%
- Sales volume: 8 transactions (period 1) vs. 9 transactions (period 2) — an increase of +12.5%
The decline in median and average prices warrants a measured read. With only 8 and 9 sales in each period, individual transactions carry outsized weight. The first period included a $455,000 sale at 148 SW Fairlawn and a $445,000 sale at 339 SW Woodbury that pushed averages higher. The second period included a proportionally larger share of mid-range ranches in the $270,000-$330,000 range. The underlying demand signals—fast sales, high list-to-sale ratios—have not deteriorated. This reads as mix-shift and normal variance, not a price correction.
Seller Concessions: What Buyers Are Actually Getting
Six of 17 standard sales (35.3%) included some level of seller participation, averaging $9,181 per transaction when concessions were part of the deal. That's a meaningful data point: more than one in three buyers in West Hills and Cedar Crest over the past two years negotiated some form of financial assistance from the seller.
Concessions in this price range most commonly take the form of credits toward closing costs or discount points to buy down the buyer's interest rate—practical tools in an elevated rate environment. Buyers who need this help are finding some success in negotiations, particularly on homes that have been on the market for more than a week. Fresh listings with strong early showings are less likely to involve seller contributions.
West Hills & Cedar Crest Home Sales by Style
| Home Style | Sales | Avg Sold Price | Median Sold Price | Avg Days on Market | Avg List-to-Sale |
|---|---|---|---|---|---|
| Ranch | 10 | $345,060 | $322,350 | 16.7 days* | 99.4% |
| 1.5 Story | 2 | $450,000 | $450,000 | 16.0 days | 99.5% |
| 2 Story | 2 | $317,500 | $317,500 | 3.5 days | 95.3% |
| Split | 2 | $297,500 | $297,500 | 1.5 days | 101.1% |
| Bi-Level | 1 | $277,000 | $277,000 | 3.0 days | 98.9% |
*Ranch DOM average is elevated by two outlier properties (44 and 67 days) that required significant price reductions. Excluding those two, the remaining 8 ranch sales averaged 5.6 days on market. Single-transaction categories (Bi-Level) reflect one sale only; treat as illustrative rather than statistical.
Ranch Homes in West Hills & Cedar Crest
Ranch homes are the defining product of these neighborhoods, and the data reflects that. Ten of 17 standard sales were ranches—nearly 59% of the market. These are mid-century single-story homes, most built between the 1940s and 1970s, ranging from 1,600 to nearly 4,750 square feet above grade. That range explains the wide price spread: $270,000 on the low end to $460,000 at the top for standard sales.
Ranch homes here averaged $345,060 and sold at 99.4% of asking price. The 67-day outlier (a 2,868-square-foot ranch on Whitehall Lane, listed at $625,000, ultimately sold at $460,000 after a $165,000 price correction) is the most dramatic example of overpricing consequences in this dataset. When excluded, ranch homes behave similarly to the rest of the neighborhood: fast, decisive, and close to asking.
1.5-Story Homes
With only two sales, 1.5-story homes carry a high degree of data uncertainty, but both transactions were notable. These homes averaged $450,000—approximately 30% above the neighborhood median—and sold at 99.5% of list price in an average of 16 days. Both had substantial square footage (2,864 and 3,180 above grade) and larger lot sizes, which helps explain the premium. Buyers looking for the most space in this neighborhood may find 1.5-story homes represent the ceiling of the market.
2-Story and Split-Level Homes
Two-story homes averaged $317,500—roughly 8% below the neighborhood median—but sold quickly (3.5 days average). The two 2-story transactions were at different price points ($275,000 and $360,000), reflecting how widely condition and size can vary even within the same style category.
Split-level homes were the fastest-selling style in the neighborhood, averaging just 1.5 days on market and a list-to-sale ratio of 101.1%—the only style to average above asking price. That's a meaningful signal: splits at $245,000 to $350,000 represent relative value in this neighborhood and attract competitive attention when they hit the market. The two split transactions were priced attractively relative to their size and location, and buyers responded accordingly.
What This Means for West Hills & Cedar Crest Home Sellers and Buyers
If You're Selling in West Hills or Cedar Crest
Pricing accuracy is the single most important variable in your outcome. The data from the past two years is unambiguous on this point: homes priced correctly sold in under a week at or above asking. Homes that tested the market above fair value spent weeks sitting before conceding to price reductions and still sold at a discount. There is no reward for overpricing here—only cost.
Presentation matters in this price range. Buyers spending $300,000 to $460,000 on a mid-century home have options and expectations. Updated kitchens, fresh paint, and move-in-ready condition consistently outperform homes that ask buyers to overlook deferred maintenance. In a neighborhood where the average DOM for accurately priced homes is under five days, a strong first week on market is everything.
On concessions: roughly one in three sellers contributed to buyer closing costs in recent transactions. If you want to avoid concessions, price the home right and let early offer volume be your leverage. If you're willing to offer concessions, building them into the list price negotiation is more effective than offering them upfront.
If You're Buying in West Hills or Cedar Crest
Get pre-approved before you tour, not after. A 4-day median DOM means the window to act is narrow. Buyers who show up to a showing without financing in order will lose to buyers who don't. This neighborhood moves at a pace that doesn't accommodate delays in lender paperwork.
The 99.09% average list-to-sale ratio means the days of expecting meaningful discounts off asking price are largely behind us here. On fresh listings in the first week, the market tends to settle at or very near list. Your negotiating leverage improves considerably if a home has been on the market for more than 10-14 days—that's when sellers start asking why, and when a thoughtful offer with a few terms in your favor is more likely to land.
Concessions are available—35% of buyers secured them—but they require the right conditions. Ask your agent to assess each situation. On competitive listings with strong early activity, asking for $10,000 toward closing costs may cost you the contract. On a home that has been sitting, it's a reasonable negotiating position.
Looking Ahead
West Hills and Cedar Crest have the fundamentals that support long-term value retention: established character, low inventory, owner-occupied housing stock, and a location that doesn't replicate easily. Buyers are not choosing these neighborhoods for convenience alone—they're choosing them for the mature lots, the architecture, and the sense of place that takes decades to develop.
The modest year-over-year price adjustment seen in recent data is consistent with a market normalizing from prior peaks, not deteriorating. Volume is up slightly, pricing discipline remains strong among well-positioned listings, and demand fundamentals are intact. Homeowners in these neighborhoods are sitting on equity positions that have grown substantially over the past several years, and nothing in the current data suggests meaningful downside risk in the near term.
Ready to Talk About Your West Hills or Cedar Crest Home?
If you're thinking about selling, the most valuable first step is a current market valuation based on what buyers are actually paying right now—not automated estimates that don't account for condition, lot size, or recent neighborhood comps. We can walk you through exactly where your home fits in the current market.
If you're looking to buy, inventory in this neighborhood is limited and moves fast. Let's talk about what you're looking for, what the realistic search timeline looks like, and how to put yourself in the best position when the right home hits the market.
No pressure, no obligation. If you just have questions about the neighborhood or want to understand what the data means for your specific situation, we're happy to have that conversation too.
Reach out to Team Ringgold at Keller Williams One Legacy Partners or visit searchtopekahomes.com to start the conversation.
Structured Market Data Summary: West Hills & Cedar Crest
Location
Neighborhood: West Hills & Cedar CrestCity: Topeka
State: Kansas
Region: Southwest Topeka
Analysis Period
Full Period: July 12, 2024 – June 2, 2026Year 1: July 12, 2024 – June 17, 2025
Year 2: June 18, 2025 – June 2, 2026
Transaction Volume
Standard MLS Sales (headline metrics): 17Off-Market / Sold Before Process MLS: 3 (excluded from headline metrics)
Total Sold Records: 20
Active/Under Contract at Export: 4 (not included in analysis)
Price Statistics (17 Standard Sales)
Median Sold Price: $324,700Average Sold Price: $344,565
Minimum Sold Price: $245,000
Maximum Sold Price: $460,000
Average Price Per Above-Grade Sq Ft: $153.78
Median Price Per Above-Grade Sq Ft: $152.84
Market Velocity
Median Days on Market: 4 daysAverage Days on Market: 12.5 days
Average (excluding 2 outliers at 44 and 67 days): 4.4 days
Average List-to-Sale Ratio: 99.09%
Median List-to-Sale Ratio: 100.00%
Pricing Behavior
Seller Concession Rate: 35.3% (6 of 17 sales)Average Concession When Offered: $9,181
Price Reduction Rate: 23.5% (4 of 17 sales)
Average Reduction Amount (when reduced): $42,650
Year-Over-Year Comparison (Standard Sales Only)
Period 1 (July 2024 – June 17, 2025): 8 sales | Median $335,000 | Average $356,250Period 2 (June 18, 2025 – June 2, 2026): 9 sales | Median $324,700 | Average $334,178
Median Price Change: –$10,300 (–3.1%)
Average Price Change: –$22,072 (–6.2%)
Volume Change: +1 sale (+12.5%)
Interpretation: Mix-shift in home type/size between periods; demand fundamentals remain intact
Sales by Home Style (Standard Sales)
Ranch: 10 sales | Avg $345,060 | Median $322,350 | Avg DOM 16.7 days* | L2S 99.4%1.5 Story: 2 sales | Avg $450,000 | Median $450,000 | Avg DOM 16.0 days | L2S 99.5%
2 Story: 2 sales | Avg $317,500 | Median $317,500 | Avg DOM 3.5 days | L2S 95.3%
Split: 2 sales | Avg $297,500 | Median $297,500 | Avg DOM 1.5 days | L2S 101.1%
Bi-Level: 1 sale | Avg $277,000 | Median $277,000 | Avg DOM 3.0 days | L2S 98.9%
*Ranch DOM elevated by two outlier properties (44 and 67 days)
Off-Market / Distressed Sales (Excluded from Headline Metrics)
4706 SW West Hills DR | $180,000 | Ranch | Sept 2025 | Sold Before Process MLS330 SW Woodbury LN | $247,000 | Ranch | Nov 2024 | Sold Before Process MLS
4701 SW Brentwood RD | $360,000 | Ranch | Apr 2026 | Sold Before Process MLS
Market Characterization
Seller-Favorable / Low-Inventory Established NeighborhoodWell-priced homes sell in days at or above asking; buyer leverage exists on stale listings and when requesting concessions; mid-century ranch architecture dominates; pricing discipline is the primary seller variable.
