
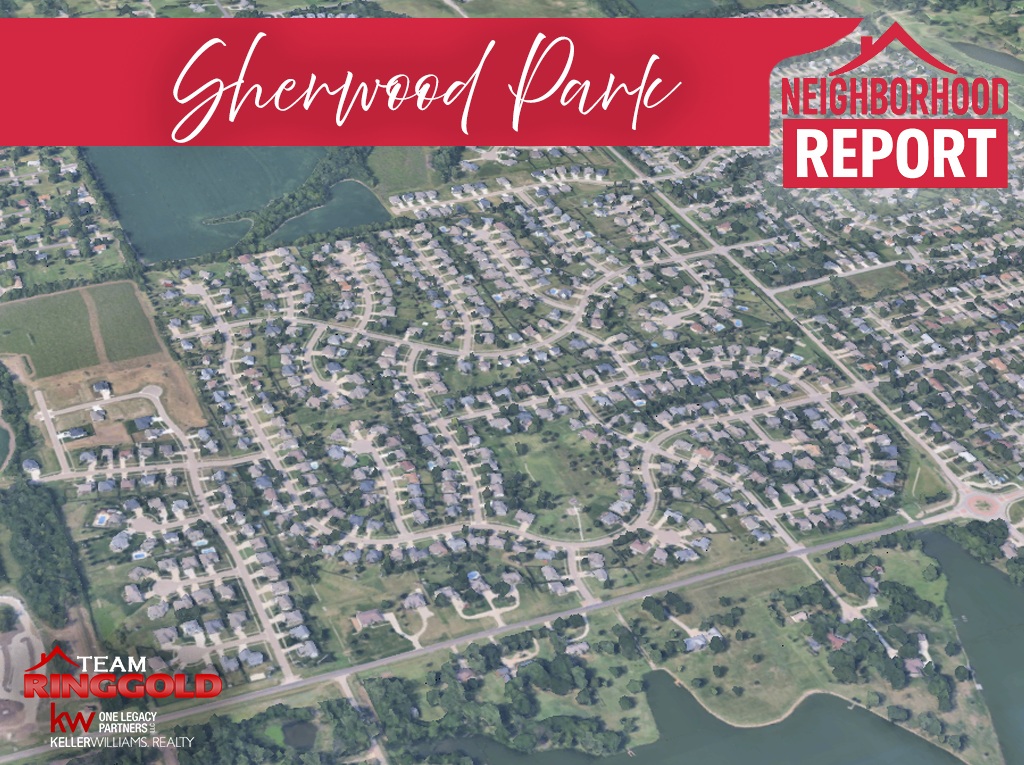
Sherwood Park Real Estate Market Report | Year-Over-Year Trends & Insights
Sherwood Park at a Glance
| Metric | Value | Context |
|---|---|---|
| Average Home Price | $411,311 | Reflects the full range, including new construction and a luxury outlier at $679,500 |
| Median Home Price | $391,000 | The midpoint price; half of all homes sold above this figure and half below |
| Price Range | $289,000 – $679,500 | Wide range driven by home size, age, and whether finished basement is included |
| Average Days on Market | 28 days | Average is pulled up by a handful of overpriced listings; most homes move faster |
| Median Days on Market | 13 days | More than half of all homes went under contract within two weeks of listing |
| List-to-Sale Price Ratio | 99.1% | Sellers are recovering nearly full asking price; buyers have minimal negotiating margin |
| Average Price Per Sq Ft | $222 / sq ft | Based on above-grade finished area; varies significantly by home style and age |
| Year-Over-Year Growth | +1.7% (avg) / +3.2% (median) | Modest, sustainable appreciation; median growth better reflects typical transaction |
| Total Sales Analyzed | 61 closed sales | September 2024 through September 2026; includes both resale and new construction |
Sherwood Park Real Estate: Frequently Asked Questions
These questions reflect what buyers, sellers, and investors most commonly ask when researching Sherwood Park real estate. The answers are drawn directly from 61 closed sales over the recent two-year period.
How much do homes cost in Sherwood Park?
The average sold price in Sherwood Park is $411,311, with a median of $391,000. Over the recent 24-month analysis period, homes ranged from $289,000 on the low end to $679,500 on the high end. The lower end of that range reflects an older 2-story home that sat on market for nearly two months, while the upper end is a custom-built ranch that sold off-market.
For practical budgeting, most buyers targeting Sherwood Park should plan for the $340,000 to $500,000 range, where the bulk of transactions occur. Ranch-style homes, which dominate the neighborhood at about 80% of all sales, average $421,402. Two-story homes average closer to $358,000, making them the more accessible entry point if that style works for your household.
How long does it take to sell a home in Sherwood Park?
The median days on market in Sherwood Park is 13 days, meaning more than half of all homes go under contract within two weeks of hitting the market. The average is 28 days, but that figure is pulled upward by a small group of overpriced listings that eventually adjusted and sold after extended market time.
Well-priced homes in move-in condition routinely go under contract within a week, and several in the dataset sold in one or two days. Sellers who price accurately from the start are rewarded with faster sales and better terms. Overpricing by more than 5% tends to produce the extended marketing periods that skew the average upward.
Is Sherwood Park a seller's market or buyer's market?
Sherwood Park sits in moderately seller-favorable territory based on recent market data. A 99.1% list-to-sale ratio means sellers are recovering nearly their full asking price, and more than half the neighborhood's homes sell within two weeks. Those are clear indicators of seller-side strength.
That said, the market is not one-sided. About 31% of sellers reduced their original asking price before going under contract, and roughly 26% offered some form of buyer concession. These numbers suggest that buyers who are patient and strategic can find opportunities, particularly on homes that have been sitting for more than 30 days.
Are home prices increasing in Sherwood Park?
Yes, but the growth is modest and steady rather than dramatic. Comparing the first 12 months of data (September 2024 through August 2025) to the second period (September 2025 through September 2026), the average sold price rose 1.7%, from $408,025 to $414,938. The median sold price increased more meaningfully, up 3.2% from $387,500 to $400,000.
This level of appreciation reflects healthy, sustainable market fundamentals. Sherwood Park is not experiencing the kind of speculative price inflation that creates instability; it is appreciating at a rate that reflects genuine demand, solid housing stock, and the neighborhood's established reputation in southwest Topeka. Buyers who purchase here can reasonably expect continued value retention.
What types of homes sell best in Sherwood Park?
Ranch-style homes are the dominant product in Sherwood Park by a wide margin, representing about 80% of all sales over the analysis period. These homes range considerably in size, age, and finish level, which accounts for the broad price spread from the mid-$300s to the upper $600s.
Two-story homes account for about 13% of sales and tend to close faster than ranch homes on average. A small number of 1.5-story homes and one split-level rounded out the mix. The neighborhood's clear preference for ranch living reflects both the buyer demographic and the original development design of the area, which skews toward larger lots and single-story layouts.
Do homes in Sherwood Park sell for asking price?
The overall list-to-sale ratio is 99.1%, which means the average home closes at just under its asking price. About 18% of homes sold at or above their list price, including several that went over by 2% to 5%, while most of the remainder closed within 1% to 3% below asking.
This is a well-calibrated market. Buyers who come in at or near asking price on well-prepared, correctly priced homes are generally competitive. Lowball offers of 5% to 10% below list tend to be rejected outright on move-in-ready homes priced accurately. Where buyers find more room to negotiate is on properties that have been on market for more than 45 days or have had a price reduction, which signals a seller who has already adjusted expectations.
How does Sherwood Park compare to other Topeka neighborhoods?
With an average sold price of $411,311 and a median of $391,000, Sherwood Park sits in the upper tier of Topeka's residential market. The neighborhood's southwest location, established street infrastructure, mix of mature and newer construction, and strong list-to-sale ratio all point to a community that holds value well relative to comparable southwest Topeka neighborhoods.
The presence of active new construction within the neighborhood, with several homes built between 2022 and 2026 appearing in the sales data, speaks to continued investment confidence in the area. That combination of established resale inventory and fresh new product gives buyers meaningful options at a range of price points without having to look elsewhere in the metro.
What is the price per square foot in Sherwood Park?
Based on above-grade finished area, the average price per square foot in Sherwood Park is $222 across all styles. That figure varies considerably by home type. Ranch homes, which often have substantial finished basement space that adds value but is not counted in above-grade calculations, average $231 per square foot above grade. Two-story homes average closer to $180 per square foot above grade, partly because their total above-grade square footage tends to be larger and partly because the market prices them at a lower per-foot premium than ranch layouts.
Buyers should be careful not to use price per square foot as the primary decision metric in Sherwood Park. Two homes with identical above-grade square footage can differ by $80,000 or more based on finished basement square footage, lot size, garage capacity, and year of construction.
Are sellers offering closing cost assistance in Sherwood Park?
About 26% of sellers offered some form of concession over the recent two-year period, with an average concession amount of approximately $4,978 among those who offered. This is not universal, but it is common enough that buyers working with a financial constraint or rate buydown need should factor this into their offer strategy.
Concessions tend to appear more frequently on homes that took longer to sell or where the seller had already reduced the original price. On fast-moving homes, particularly those that receive multiple offers, concessions are rarely on the table. Your best leverage for securing seller participation comes from homes with more than 30 days on market or those that have undergone a price reduction.
What is the best time to sell a home in Sherwood Park?
Based on transaction volume in the recent data, summer is the peak season for Sherwood Park sales. July and August consistently produced the highest monthly transaction counts, with summer accounting for a disproportionate share of all closings. Spring listing activity (March through May) also generates strong buyer traffic and leads to solid close volumes through May and June.
The practical implication: sellers who list in late April through early July are positioning themselves during peak buyer engagement. That said, well-priced, well-presented homes in Sherwood Park sell throughout the year. The fall and winter months see fewer competing listings, which can actually work in a seller's favor by reducing inventory competition even as buyer traffic slows slightly.
Market Overview
Sherwood Park is a well-established residential neighborhood in southwest Topeka that has produced consistent, sustainable market performance over the recent 24-month analysis period. Sixty-one closed sales, spanning a price range from $289,000 to $679,500, tell the story of a neighborhood with genuine depth and range.
The average sold price of $411,311 reflects a broad mix: entry-level ranch homes in the high $300s, move-up ranch and two-story homes in the $400s, and a growing segment of new construction pushing into the $480,000 to $550,000 range. A single luxury custom build at $679,500 is notable but atypical for the neighborhood.
Market pace has been healthy. Homes average 28 days from list to contract, and more than half go under contract within 13 days. At a 99.1% list-to-sale ratio, sellers are not discounting their homes to get them sold. The market leans moderately toward sellers while still giving buyers a realistic path to homeownership without extreme competition pressure.
Sherwood Park's combination of established infrastructure, proximity to southwest Topeka amenities, and active new construction investment positions it as one of the more stable value propositions in the Topeka residential market.
Ranch-style homes dominate at roughly 80% of all sales, which is consistent with the neighborhood's original development design and the buyer demographic that gravitates toward the area. Two-story, 1.5-story, and split-level homes represent a smaller but meaningful share of the market and tend to attract a different buyer profile, particularly families prioritizing separation of living and sleeping areas.
Deeper Dive Analysis
Days on Market: What the Numbers Actually Mean
The gap between Sherwood Park's 28-day average and 13-day median is significant and tells a more nuanced story than either number alone. The median of 13 days confirms that well-prepared, correctly priced homes move quickly. More than half the sales in the dataset went under contract within two weeks.
The average is pulled upward by a small group of outliers, including two properties that required 139 and 189 days respectively to find buyers. Both were likely initially overpriced relative to the market and required extended time and price adjustments before going under contract. That is not a market problem; it is a pricing strategy problem, and it is correctable. Removing those two extreme outliers from the dataset would bring the average DOM down to approximately 23 days.
For sellers, the takeaway is clear: accurate pricing is the single most powerful lever available. Homes priced within 2% to 3% of market value are going under contract in under two weeks on average. Homes that test the top of the market at 8% to 10% above comparable sales risk sitting long enough to stigmatize themselves and ultimately closing at or below where they would have priced correctly from the start.
For buyers, a 13-day median means urgency is appropriate on homes you genuinely want. Waiting for a second showing or taking a few extra days to "think about it" on a well-priced home in Sherwood Park carries real risk of losing the property. Come prepared, know your numbers, and be ready to move.
Pricing Trends: Appreciation, Reductions, and the 99.1% Story
The 99.1% list-to-sale ratio is one of the more telling single statistics in this dataset. It means that, on average, sellers in Sherwood Park are closing at essentially their asking price. That leaves very little room for the kind of negotiation many buyers expect. Eighteen percent of homes actually sold above list, and most of those were only modestly over (1% to 5%), not the result of dramatic bidding wars.
About 31% of sellers reduced their original asking price before going under contract, with an average reduction of approximately $19,000. This sounds significant, but context matters. Most of those reductions brought properties from an aspirational original price down to their actual market value, where they promptly found buyers. The reduction is not a sign of market weakness; it is the normal process of price discovery in a market where sellers tend to test the high end before settling in.
Year-over-year, the average sold price in Sherwood Park increased approximately 1.7%, rising from $408,025 in the first 12 months of the analysis period to $414,938 in the second. The median sold price showed a slightly stronger gain of 3.2%, moving from $387,500 to $400,000. The median growth rate is likely a more accurate picture of typical market appreciation, as the average in Year 2 is influenced upward by the $679,500 luxury sale.
Either way, 2% to 3% annual appreciation represents sustainable, fundamentals-driven growth. It is not the kind of double-digit run-up that creates instability, and it is not the kind of flatness that signals stagnation. Sherwood Park appears to be in a healthy equilibrium where supply, demand, and price are reasonably aligned.
Seller Concessions: Leverage Indicators
Seller concessions, meaning closing cost assistance, rate buydowns, or similar buyer support paid by the seller, appeared in about 26% of all transactions. The average concession amount among sellers who offered was approximately $4,978. That is a meaningful number for rate-sensitive buyers, as $5,000 in seller-paid buydown points can meaningfully reduce the effective mortgage rate over the life of the loan.
The 74% of transactions with no seller concessions reflects the overall seller-side strength of the market. Sellers who price correctly, present their homes well, and catch the spring or summer market typically have no reason to offer concessions. The concession behavior tends to cluster around properties that took longer to sell or where the final negotiation included some give-and-take on terms rather than purely on price.
Comparative Analysis by Home Style
Ranch-style homes dominate Sherwood Park, but the other styles that have sold over the recent two-year period show meaningfully different price points and market behaviors. The table below captures the full picture.
| Home Style | Homes Sold | Average Price | Median Price | Avg. Days on Market | List-to-Sale Ratio |
|---|---|---|---|---|---|
| Ranch | 49 (80%) | $421,402 | $400,000 | 30 days | 99.0% |
| 2 Story | 8 (13%) | $357,662 | $356,250 | 25 days | 98.9% |
| 1.5 Story | 3 (5%) | $415,000 | $436,000 | 14 days | 99.7% |
| Split Level | 1 (2%) | $335,000 | $335,000 | 1 day | 101.5% |
Note: Split-level data represents a single sale and should be interpreted accordingly. Style comparisons are most meaningful for Ranch and 2 Story, which have statistically significant sample sizes.
Ranch Homes
Ranch homes are the clear defining product of Sherwood Park, accounting for 80% of all sales over the analysis period. With 49 closed transactions, this is a statistically solid sample. The average sold price of $421,402 reflects a wide internal range, from entry-level ranches in the mid-$300s to custom-built new construction pushing past $600,000.
Ranch homes in Sherwood Park average 30 days on market and close at 99.0% of list price, consistent with the neighborhood-wide trend. Main-floor living, garage capacity, and lot size are the primary drivers of value within this category. Homes with substantial finished basement square footage command meaningfully higher prices than unfinished or partially finished basement counterparts, even when above-grade dimensions are similar. At $231 per above-grade square foot, ranch homes command a premium per-foot rate compared to other styles, largely because the basement finished area adds value without being counted in that calculation.
2 Story Homes
Two-story homes in Sherwood Park average $357,662 and represent the most accessible price point in the neighborhood. That is approximately $63,740 less (or about 18% below) the average ranch price. This gap reflects both style preference and the market's premium for ranch living, not necessarily a quality or size differential.
Two-story homes actually sell slightly faster than ranch homes, averaging 25 days on market versus 30 for ranches. At 98.9% list-to-sale ratio, they are essentially tied with ranch homes on pricing accuracy. For buyers who can adapt to a two-floor lifestyle, these homes represent a meaningful value advantage in the neighborhood. The 8 two-story sales in the dataset ranged from $289,000 to $400,000, covering a range of ages, sizes, and finishes.
Two-story homes cost approximately $51 per above-grade square foot less than ranch homes ($180 vs. $231). That difference narrows considerably when finished basement square footage is factored into the total value equation, but it remains a real distinction for buyers comparing above-grade living space dollar-for-dollar.
1.5 Story Homes
Only three 1.5-story homes sold during the analysis period, so conclusions should be drawn carefully. That said, the data is interesting: these homes averaged $415,000, nearly identical to the overall neighborhood average, and they sold in an average of just 14 days, the fastest of any style in the dataset. The 99.7% list-to-sale ratio is the strongest among style categories with more than one sale.
The 1.5-story format, with its partial second floor typically containing bedrooms, occupies a middle ground between ranch convenience and two-story separation. In a neighborhood heavily oriented toward ranch buyers, these homes may appeal to a specific buyer who wants some bedroom separation without a full two-story commitment. The limited supply and fast pace suggest these homes compete well when they come to market.
What This Means for You
If You're Selling in Sherwood Park
Price it right from day one. The data is unambiguous on this point. Homes priced accurately within the current comparable range are going under contract in under two weeks and closing at 99% or better of list. Homes that test the market at 8% or more above comparables are producing the 60- to 189-day market times that become negotiating liabilities. The right price is not the highest price; it is the price that generates competitive buyer activity while leaving you in the strongest possible position at the table.
Presentation matters at this price point. Buyers targeting the $350,000 to $500,000 range in southwest Topeka have options. Sherwood Park competes well, but a home that shows clean, updated, and move-in ready will consistently outperform one that needs work. Professional photography, curb appeal, and attention to the small deferred maintenance items that show up in inspections are worth the investment.
Concessions are negotiable, not automatic. About 26% of sellers offered concessions, but the other 74% did not. If your home is in strong condition and priced accurately, you are not obligated to offer closing cost assistance. That said, if you find yourself in a longer-than-expected marketing period, offering $4,000 to $6,000 in seller-paid concessions may be the most efficient way to bring in a qualified buyer rather than continuing to carry the home.
Seasonality is real. Summer is when Sherwood Park moves. August of 2025 alone produced 8 closed sales, the highest single-month volume in the dataset. If you have flexibility on timing, aim for a late-April through mid-July list date to capture peak buyer activity.
If You're Buying in Sherwood Park
Move with intention on homes you want. A 13-day median means the window on a well-priced home closes fast. If you see a property that checks your boxes and is correctly priced relative to comparables, a same-day or next-day offer is not overreacting; it is responding appropriately to market conditions.
Come pre-approved, not just pre-qualified. At the $390,000 to $450,000 price points where most of Sherwood Park trades, sellers expect buyers who are ready to close. An underwritten pre-approval letter from a reputable lender puts you in a materially different position than a pre-qualification letter, particularly if you find yourself in a multiple-offer situation.
Negotiating leverage exists, but it is targeted. On homes with 30-plus days on market, a price reduction history, or a concession offer already in the listing, buyers have room to negotiate. On homes that just listed and are showing well, expect minimal room. Know which situation you are in before structuring your offer.
Look at two-story homes if ranch is out of budget. Two-story homes in Sherwood Park average about $64,000 less than ranch homes. If the neighborhood is where you want to be and the ranch options feel stretched, the two-story inventory gives you access to the same streets, schools, and community at a meaningfully lower average price point.
Looking Ahead
Sherwood Park's fundamentals are solid. The 2% to 3% annualized appreciation reflected in the recent data is the kind of steady, compounding growth that builds long-term equity without the volatility of speculative markets. Active new construction within the neighborhood suggests continued developer confidence in the area's desirability, which typically supports rather than dilutes resale values.
The presence of both established homes from the late 1990s and early 2000s and fresh new construction from 2022 through 2026 gives the neighborhood generational appeal. Move-up buyers from elsewhere in Topeka, downsizing empty-nesters from larger properties, and first-time buyers stepping into the $340,000 to $380,000 range are all represented in the sales data. That demographic diversity is a stabilizing force.
Nothing in this data suggests a market in stress. The list-to-sale ratio is healthy, the DOM is reasonable, and year-over-year appreciation is positive. Sherwood Park continues to perform as a dependable, value-retaining southwest Topeka neighborhood.
Ready to Make Your Move in Sherwood Park?
If You're Thinking About Selling
You don't need to guess what your Sherwood Park home is worth today. Team Ringgold pulls the actual closed sales in your immediate area, accounts for your home's specific features, and gives you a straightforward valuation built on real data, not algorithms. There's no obligation and no pressure. If you're curious about your numbers, we're happy to walk through them with you.
Visit searchtopekahomes.com or reach out to Team Ringgold directly to schedule your no-obligation home valuation.
If You're Looking to Buy
Sherwood Park has active inventory, and new listings come to market regularly. Whether you're eyeing a ranch in the $370s or a newer build in the $480s, having an experienced buyer's agent in your corner means you hear about listings early, write competitive offers, and understand what the data actually says about each property you're considering.
Connect with Team Ringgold at Keller Williams One Legacy Partners. We work this neighborhood regularly and know the streets.
Just Exploring Your Options?
That's completely fine. The southwest Topeka market moves at its own pace, and the right time to buy or sell is when it makes sense for you, not because someone told you to act now. If you'd like a no-pressure conversation about where Sherwood Park fits within your broader goals, we're available for that too.
No hard pitch. Just real information from people who work this market every day.
Structured Data Summary
Neighborhood: Sherwood Park
City: Topeka
State: Kansas
Analysis Period: September 16, 2024 – September 2, 2026 (24 months)
Data Source: Sunflower MLS (Paragon)
Report Author: Team Ringgold, Keller Williams One Legacy Partners
Total Closed Transactions: 61
Average Sold Price: $411,311
Median Sold Price: $391,000
Lowest Sale: $289,000 (2-story, 2001 build)
Highest Sale: $679,500 (ranch, 2025 new construction, sold off-market)
Average Price Per Square Foot (above grade): $222
Average Days on Market: 28 days
Median Days on Market: 13 days
Homes Under Contract Within 7 Days: approximately 46%
Homes With 30+ Days on Market: approximately 33%
List-to-Sale Price Ratio: 99.1%
Homes Sold at or Above List Price: 11 (18% of all sales)
Homes With Price Reductions: 19 (31% of all sales)
Average Price Reduction Amount: $19,000
Sellers Offering Concessions: 16 (26% of all sales)
Average Concession Amount (among those who offered): $4,978
Year-Over-Year Comparison:
Year 1 (September 2024 – August 2025): 32 sales — Average $408,025 — Median $387,500
Year 2 (September 2025 – September 2026): 29 sales — Average $414,938 — Median $400,000
YoY Change (Average): +1.7%
YoY Change (Median): +3.2%
Home Style Distribution:
Ranch: 49 homes (80.3%) — Avg $421,402 — Median $400,000 — Avg DOM 30 — L/S 99.0%
2 Story: 8 homes (13.1%) — Avg $357,662 — Median $356,250 — Avg DOM 25 — L/S 98.9%
1.5 Story: 3 homes (4.9%) — Avg $415,000 — Median $436,000 — Avg DOM 14 — L/S 99.7%
Split Level: 1 home (1.6%) — Avg $335,000 — Median $335,000 — Avg DOM 1 — L/S 101.5%
Key Comparative Statements:
Ranch homes average $63,740 (18%) more than 2 Story homes
1.5 Story homes sell approximately 16 days faster than Ranch homes on average
2 Story homes sell approximately 5 days faster than Ranch homes on average
Ranch homes command $231/sqft (above grade); 2 Story homes average $180/sqft (above grade)
Split Level (1 sale) closed at 101.5% of list price, the only style averaging over asking
Market Classification: Moderately Seller-Favorable
Market Health: Stable, sustainable appreciation; no distress indicators
New Construction Presence: Active; multiple homes built 2022–2026 represented in sales data
