
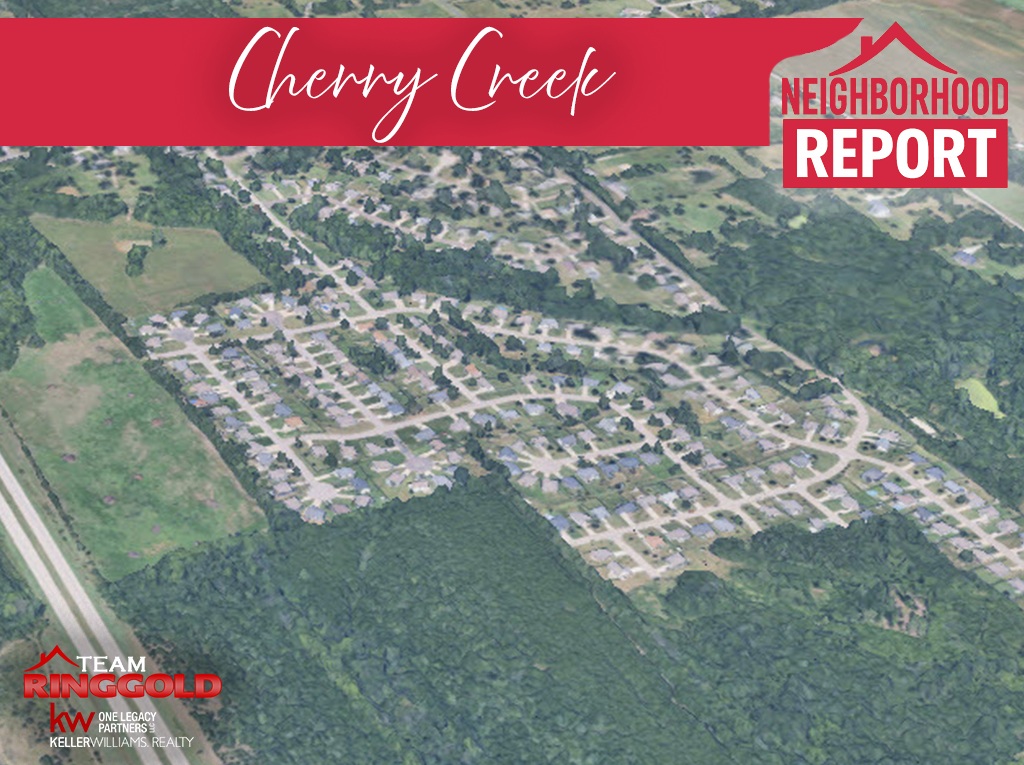
Cherry Creek Topeka Home Values: Market Trends and Sales Data
Cherry Creek, a Northwest Topeka neighborhood built primarily in the late 1990s and 2000s, has posted steady price growth and quick sales over the past two years. This report breaks down what homes are actually selling for in Cherry Creek, how fast they're moving, and what that means whether you're buying or selling here.
| Metric | Value | Context |
|---|---|---|
| Median Sold Price | $289,500 | Primary benchmark; less swayed by high or low outliers |
| Average Sold Price | $289,985 | Nearly identical to the median, indicating a tight, consistent price band |
| Price Range | $196,000 – $369,900 | Spans older Bi-Level homes to newer, larger Ranch homes |
| Median Days on Market | 6.5 days | Half of all Cherry Creek homes went under contract within a week |
| Average Days on Market | 12.6 days | Pulled higher by a handful of listings that took 45-63 days |
| List-to-Sale Price Ratio | 100.0% (median) | Measured against final asking price; homes are typically selling at or slightly above ask |
| Price Per Square Foot | $216 (median) | Based on above-grade finished square footage |
| Year-Over-Year Price Growth | +12.1% (median) | July 2024–July 2025 ($272,000 median) vs. July 2025–July 2026 ($305,000 median) |
| Total Arm's-Length Sales | 30 | Over the 24-month analysis window; 3 additional off-market sales disclosed separately |
Cherry Creek Market Overview
Over the past two years, Cherry Creek has recorded 30 arm's-length sales with a median price of $289,500 and an average price of $289,985. Those two figures sitting so close together tells you something useful on its own: this is a neighborhood without a lot of wild swings. Most homes here are landing in a fairly predictable price band rather than being pulled around by a few outsized sales.
Homes are moving fast. The median Cherry Creek listing was under contract in just 6.5 days, and the list-to-sale ratio sits right at 100.0%, meaning the typical home sells for exactly what it was asking. That combination of quick sales and full-price offers points to strong, consistent buyer demand rather than a market that's cooling off or waiting on sellers to come down.
Price reductions were relatively uncommon: only 6 of the 30 sales (20%) saw the asking price drop from the original list price, with an average reduction of about $11,325, or roughly 4.1%. On the flip side, seller concessions showed up more often, appearing in 11 of 30 sales (36.7%) at an average of $4,718. That's a market where sellers are holding firm on price but staying flexible on closing costs to keep deals moving.
Deeper Dive: Cherry Creek Pricing, Speed, and Concessions
Days on Market: What the Median vs. Average Tells You
The median days on market (6.5) and average (12.6) diverge because a handful of listings took considerably longer to sell. Three homes sold in 45 to 63 days, well above the typical Cherry Creek pace, while the bulk of sales closed inside two weeks. For sellers, this means pricing accurately from day one matters. Homes that hit the market at the right number are selling almost immediately; homes that sit are usually the ones priced a step ahead of what buyers are willing to pay. For buyers, it means you generally don't have the luxury of a long decision window. If a Cherry Creek home fits what you're looking for, be ready to move on it within days, not weeks.
Pricing Trends
A list-to-sale ratio at 100.0% median (100.4% average) means Cherry Creek sellers are, on the whole, getting their full asking price and occasionally a bit more. Combined with the relatively low rate of price reductions, this points to accurate initial pricing across most of these listings rather than a market where sellers are routinely overshooting and correcting. The 12.1% median year-over-year price growth is meaningful but not explosive; it reads as sustainable appreciation tied to genuine demand and a tight inventory of homes in this price range, not speculative pricing that's likely to snap back.
Seller Concessions
Just over a third of Cherry Creek sellers (36.7%) offered some form of concession, averaging $4,718. In a market where homes are selling at full price this quickly, concessions here are less a sign of seller weakness and more a routine negotiating tool, often used to help buyers cover closing costs rather than to move a stagnant listing.
Year-Over-Year Snapshot: July 2024–July 2025 vs. July 2025–July 2026
Comparing the two most recent 12-month periods in the dataset shows consistent, broad-based improvement across every major metric:
- Median price: $272,000 (July 2024–July 2025) to $305,000 (July 2025–July 2026), a gain of $33,000, or 12.1%.
- Average price: $273,423 (July 2024–July 2025) to $302,650 (July 2025–July 2026), a gain of $29,227, or 10.7%.
- Sales volume: 13 arm's-length sales (July 2024–July 2025) to 17 arm's-length sales (July 2025–July 2026), an increase of 30.8%.
Price growth and sales volume rising together is a healthier signal than price growth alone; it suggests more buyers are actively transacting in Cherry Creek, not just that a shrinking pool of sales is skewing the numbers upward. Worth noting: with 13 and 17 sales in each period respectively, these are modest sample sizes for a single neighborhood, so treat the precise percentages as directional rather than exact.
Cherry Creek Homes by Style: A Comparative Look
| Home Style | Homes Sold | Median Price | Average Price | Avg. Days on Market | List-to-Sale Ratio |
|---|---|---|---|---|---|
| Ranch | 20 | $302,500 | $306,035 | 12.4 days | 100.3% |
| Bi-Level | 7 | $245,000 | $247,593 | 17.7 days | 99.6% |
| Raised Ranch (single data point) | 1 | $270,000 | $270,000 | 5 days | 103.9% |
| Split (single data point) | 1 | $280,700 | $280,700 | 3 days | 106.0% |
| 1.5 Story (single data point) | 1 | $295,000 | $295,000 | 0 days | 100.0% |
Ranch homes dominate the Cherry Creek market, accounting for 20 of the 30 sales (two-thirds of all activity), and they also command the highest median price of any style with more than one sale at $302,500. That's the product type driving most of the neighborhood's price growth and the one most buyers should expect to compete for.
Bi-Level homes are the second-most common style in Cherry Creek, at 7 sales, and are priced roughly 19% below Ranch homes on a median basis ($245,000 vs. $302,500, a difference of $57,500). Bi-Levels also took longer to sell on average, 17.7 days compared to 12.4 days for Ranch homes, roughly 43% slower. Together, this makes Bi-Level the more accessible entry point into Cherry Creek, while Ranch remains the style commanding both the fastest sales and the strongest prices.
Raised Ranch, Split, and 1.5 Story styles each had only one sale in this period. Treat their pricing and speed as single data points rather than reliable style-level trends; there simply isn't enough volume yet to draw a pattern from any of the three.
What This Means for You
If You're Selling in Cherry Creek
- Price accurately from the start. With a 100% list-to-sale ratio and a fast median sale time of 6.5 days, homes priced right are moving quickly and getting full ask. Overpricing is the more common way to end up in the 45-63 day range.
- Expect to field concession requests. More than a third of recent sellers offered concessions averaging $4,718. Build a little room into your pricing strategy to stay flexible on closing costs without cutting into your bottom line.
- Ranch homes have the strongest position. If you're selling a Ranch-style home, the data supports confident pricing near or above the $302,500 median, especially given the consistent buyer demand for this style.
- Presentation still matters. The homes that lingered 45+ days weren't outliers by style or price point, which suggests condition, staging, or initial pricing strategy played a role. A strong first impression shortens your time on market.
If You're Buying in Cherry Creek
- Come prepared to move fast. Half of Cherry Creek homes go under contract within a week. Have financing pre-approval and your decision-making process ready before you start touring.
- Don't expect much negotiating room on price. A 100% list-to-sale ratio means most sellers are getting their full asking price. Your leverage is more likely to come through concessions or closing timeline than through a lower offer.
- Bi-Level homes offer a lower entry price. If budget is the primary driver, Bi-Level homes in Cherry Creek are running about 19% below Ranch pricing and may give you more room to negotiate given their slightly longer average time on market.
- Watch for concession opportunities. With over a third of recent deals including seller concessions, it's reasonable to ask, particularly on listings that have been on the market longer than the neighborhood average.
Looking Ahead
Cherry Creek's combination of rising prices and rising sales volume points to a market with real, sustained demand rather than a temporary spike. The relatively low rate of price reductions and a list-to-sale ratio at 100% both suggest sellers are pricing with a good read on what buyers are willing to pay. Barring a broader shift in the Topeka market, Cherry Creek looks positioned to continue as a competitive, fast-moving neighborhood for the types of Ranch and Bi-Level homes that make up most of its inventory.
Thinking About Cherry Creek?
Selling your Cherry Creek home? We'll walk you through a data-backed pricing strategy built on exactly this kind of neighborhood-level analysis. Get a free home valuation from Team Ringgold.
Buying in Cherry Creek? We can help you understand what's realistic to offer and how to move fast when the right home comes up. Reach out for buyer guidance.
Just have questions about the Topeka market? No pressure, no obligation. Contact Team Ringgold at Keller Williams One Legacy Partners.
Cherry Creek Real Estate FAQ
Where is Cherry Creek located in Topeka?
Cherry Creek is a Northwest Topeka, Kansas neighborhood built primarily between the mid-1990s and mid-2000s. The neighborhood is centered around streets like Cherry Creek Drive, Fielding Terrace, Dondee Lane, and Walnut Road, and is made up mostly of Ranch and Bi-Level style homes on quarter-to-half-acre lots.
How much do homes cost in Cherry Creek?
The median sold price in Cherry Creek is $289,500, with an average of $289,985, based on 30 arm's-length sales over the past 24 months. Prices in the neighborhood have ranged from $196,000 up to $369,900, with Ranch-style homes typically commanding the higher end of that range.
How long does it take to sell a home in Cherry Creek?
The median time on market is just 6.5 days, meaning half of all Cherry Creek homes go under contract within a week of listing. The average is a bit higher, 12.6 days, pulled up by a small number of listings that took 45 to 63 days to sell.
Is Cherry Creek a good neighborhood to invest in?
Cherry Creek shows several signs that support it as a solid investment location: 12.1% median year-over-year price growth, sales volume up 30.8% year-over-year, and a list-to-sale ratio at 100%, all pointing to sustained buyer demand rather than a temporary spike. The neighborhood's mix of Ranch and Bi-Level homes also offers investors a range of price points, from roughly $245,000 up to over $300,000, depending on style.
Is Cherry Creek a buyer's market or a seller's market?
Based on current data, Cherry Creek leans toward a seller's market. Homes are selling in a median of 6.5 days at a 100% list-to-sale ratio, and only 20% of sales involved a price reduction. That combination points to demand outpacing available inventory in this price range.
How have Cherry Creek home prices changed over the past year?
Comparing July 2024–July 2025 to July 2025–July 2026, the median sold price in Cherry Creek rose from $272,000 to $305,000, a gain of $33,000, or 12.1%. The average price rose from $273,423 to $302,650, up 10.7%, while sales volume increased from 13 to 17 transactions, a 30.8% jump.
Do homes in Cherry Creek sell for asking price?
Yes. The median list-to-sale price ratio in Cherry Creek is 100.0% (100.4% on average), meaning most homes are selling for exactly their final asking price, and some are selling slightly above it.
What home styles are most common in Cherry Creek?
Ranch-style homes are the dominant style in Cherry Creek, accounting for 20 of the last 30 sales, about two-thirds of all activity. Bi-Level homes are the second most common at 7 sales. Raised Ranch, Split, and 1.5 Story homes appear in the neighborhood but each had only a single sale in this period.
What is the price per square foot in Cherry Creek?
The median price per square foot in Cherry Creek is $216, calculated against above-grade finished square footage, with an average of $218 per square foot.
How does Cherry Creek compare to other Northwest Topeka neighborhoods?
Cherry Creek's median price of $289,500 and fast 6.5-day median sale time put it among the more competitive Northwest Topeka neighborhoods. For comparison, see our reports on Hidden Valley, West Hills & Cedar Crest, and Sherwood Lake to see how nearby neighborhoods stack up on price, pace, and inventory mix.
Are sellers offering concessions in Cherry Creek?
Yes, in 11 of the last 30 sales (36.7%), sellers offered some form of concession, averaging $4,718. Given how quickly homes are selling and how close to full price they're going, these concessions are more commonly used to help buyers cover closing costs than to compensate for a stalled listing.
What's the best time to sell a home in Cherry Creek?
The data doesn't show a strong seasonal pattern in this dataset, but with homes moving in a median of 6.5 days across the full 24-month window, timing appears to matter less in Cherry Creek than accurate pricing and presentation. Well-priced listings are selling quickly in nearly every part of the year represented in this data.
Cherry Creek Structured Data Summary
- Neighborhood
- Cherry Creek
- City
- Topeka
- State
- Kansas
- Analysis Period
- August 2024 – July 2026 (24-month rolling window)
- Year-Over-Year Comparison Periods
- July 2024–July 2025 (prior) vs. July 2025–July 2026 (recent)
- Total Arm's-Length Transactions
- 30
- Off-Market Transactions (excluded from headline metrics)
- 3 — disclosed below
- Median Sold Price
- $289,500
- Average Sold Price
- $289,985
- Price Range
- $196,000 – $369,900
- Median Days on Market
- 6.5 days
- Average Days on Market
- 12.6 days
- Median List-to-Sale Ratio
- 100.0%
- Average List-to-Sale Ratio
- 100.4%
- Median Price Per Square Foot
- $216 (above-grade finished area)
- Average Price Per Square Foot
- $218
- Sales with Price Reductions
- 6 of 30 (20.0%), average reduction $11,325 (4.1%)
- Sales with Seller Concessions
- 11 of 30 (36.7%), average concession $4,718
- Year-Over-Year Median Price Change
- +$33,000 (+12.1%): $272,000 (Jul 2024–Jul 2025) to $305,000 (Jul 2025–Jul 2026)
- Year-Over-Year Average Price Change
- +$29,227 (+10.7%): $273,423 (Jul 2024–Jul 2025) to $302,650 (Jul 2025–Jul 2026)
- Year-Over-Year Sales Volume Change
- +4 sales (+30.8%): 13 (Jul 2024–Jul 2025) to 17 (Jul 2025–Jul 2026)
- Home Style Distribution
- Ranch: 20 sales (66.7%), median $302,500
- Bi-Level: 7 sales (23.3%), median $245,000
- Raised Ranch: 1 sale (3.3%), single data point
- Split: 1 sale (3.3%), single data point
- 1.5 Story: 1 sale (3.3%), single data point
- Off-Market Transaction Disclosure
- 4231 NW Fielding RD sold off-market for $85,000 on 10/23/2024 (excluded from headline metrics; the same property sold again on the open market for $270,000 on 5/1/2025, included in arm's-length figures above)
- 3810 NW Cherry Creek TER sold off-market for $315,000 on 6/10/2025
- 3530 NW 45th Pl sold off-market for $315,000 on 10/10/2025
- Market Characterization
- Seller's Market — fast sale times, full-price offers, low reduction frequency, and rising volume all point to demand outpacing available inventory in Cherry Creek's price range.
