
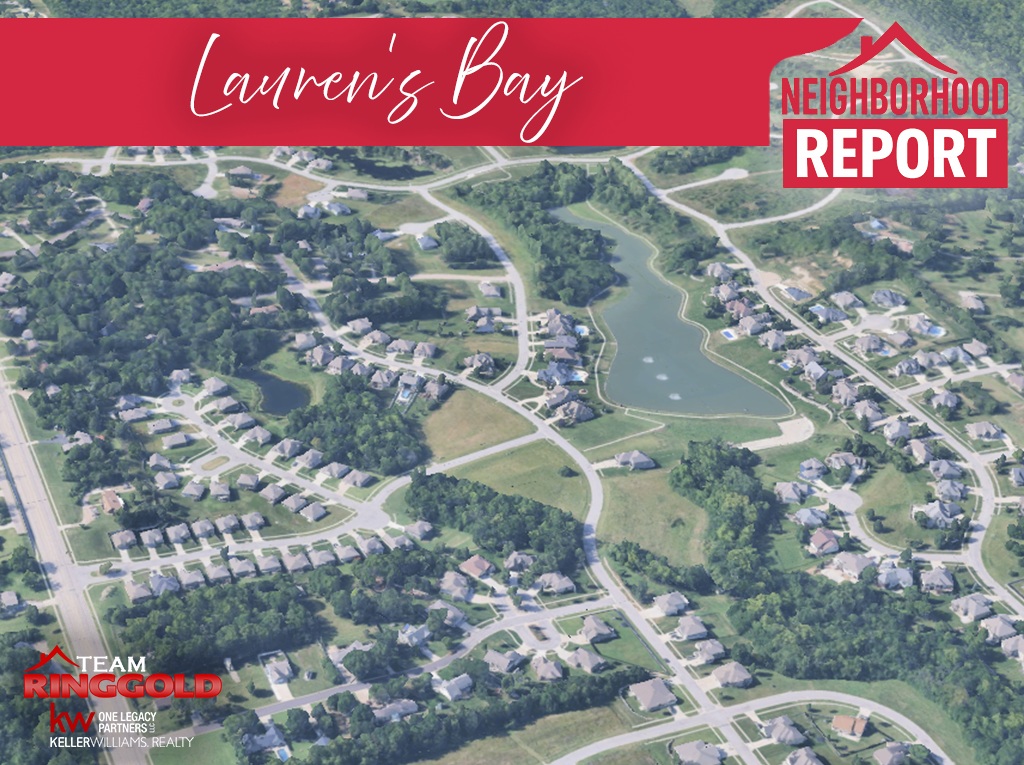
Lauren's Bay Real Estate: Quick Facts at a Glance
The table below summarizes the key metrics from 29 standard MLS closed sales in Lauren's Bay over the past two years. Three additional off-market transactions are disclosed later in this report.
| Metric | Value | Context |
|---|---|---|
| Average Sold Price | $413,631 | Mean of 29 standard MLS sales; elevated by luxury tier (see YoY note) |
| Median Sold Price | $390,000 | Mid-point price; up 3.7% year over year |
| Price Range | $285,000 – $675,000 | Wide range driven by age, size, and renovation level |
| Average Days on Market | 26.5 days | Pulled up by a few extended listings; most homes moved fast |
| Median Days on Market | 9 days | Half of all homes sold in 9 days or fewer; still a competitive market |
| List-to-Sale Price Ratio | 99.03% | Sellers received nearly full asking price on average |
| Avg. Price Per Sq. Ft. (Above Grade) | $233.56 | Above-grade finished area; total finished SF averages $152.76/sq. ft. |
| Median Price YoY Change | +3.70% | July 2024–July 2025 vs. July 2025–July 2026; $379,950 to $394,000 |
| Sellers Offering Concessions | 20.7% (6 of 29) | Most sellers held firm; avg. concession among those who paid: $3,208 |
| Homes with Price Reductions | 31.0% (9 of 29) | Avg. reduction of $26,111 (5.9%) from original list price |
| Total Closed Sales | 32 total (29 MLS + 3 off-market) | July 2024 – July 2026; off-market transactions disclosed below |
Lauren's Bay Topeka: Real Estate Questions Answered
These are the questions buyers, sellers, and curious neighbors ask most often about the Lauren's Bay real estate market. Each answer is based on actual closed sales data from the past two years.
What is Lauren's Bay in Topeka, Kansas?
Lauren's Bay is an established single-family residential neighborhood in southwest Topeka, Kansas, anchored by SW Wanamaker Road to the west and SW 42nd to SW 48th Streets along its interior street network. The neighborhood features predominantly ranch-style homes on generous lots ranging from roughly a quarter acre to over an acre, with homes spanning multiple eras of construction from the late 1950s through the early 2020s. It is one of the more geographically diverse neighborhoods in southwest Topeka in terms of home age, size, and price point.
Lauren's Bay sits within the Washburn Rural USD 437 service area, which is a significant draw for families, and it benefits from proximity to major commercial corridors along SW Wanamaker Road. The neighborhood tends to attract buyers who value space, established landscaping, and access to west Topeka amenities without paying premium new-construction prices.
How much do homes cost in Lauren's Bay Topeka?
Over the past two years, Lauren's Bay homes sold at an average price of $413,631 and a median of $390,000, based on 29 standard MLS closed transactions. The price range was wide, stretching from $285,000 at the entry level to $675,000 at the high end, reflecting the neighborhood's mix of older ranch homes, updated mid-tier properties, and larger custom builds.
The gap between the average and median is worth understanding. A cluster of luxury closings in the first year of the analysis period (including two homes that sold above $600,000) pulled the average up significantly. The median is the more reliable benchmark for typical buyers and sellers in Lauren's Bay, and the median has been rising steadily, reaching $394,000 in the most recent 12-month period.
How long does it take to sell a home in Lauren's Bay?
The median days on market in Lauren's Bay over the past two years was 9 days, meaning half of all homes sold in under a week and a half. That said, the average days on market was 26.5 days, indicating a handful of properties sat considerably longer and pulled the average upward.
Digging into the data, 44.8% of homes sold in 7 days or fewer, and 62.1% sold within 14 days. The outliers were homes that needed pricing corrections: the two longest-market properties each spent over 100 days before closing, and both came with substantial original list price reductions. The lesson is clear: correctly priced Lauren's Bay homes move fast; overpriced homes do not.
Is Lauren's Bay a seller's market or buyer's market?
Lauren's Bay is currently a moderating seller's market. The data supports seller-side strength: median days on market of just 9 days, a list-to-sale ratio of 99.03%, and nearly 80% of sellers receiving no concession requests. However, conditions have softened from the prior year, when the median days on market was just 4 days.
Buyers now have a bit more time to make decisions and a bit more negotiating room on overpriced homes, but the market remains competitive for well-priced, well-presented properties. The 31% of homes that required price reductions are the exception, not the rule, and they tend to be cases where the original ask was not supported by comparables.
How have Lauren's Bay home prices changed over the past year?
Comparing the two 12-month windows in this analysis period, the median sold price in Lauren's Bay rose 3.70%, from $379,950 (July 2024 through July 2025) to $394,000 (July 2025 through July 2026), a gain of approximately $14,050. This is a healthy, sustainable pace of appreciation that reflects genuine demand rather than speculative pressure.
The average sold price moved in the opposite direction, declining 4.67% from $415,081 to $395,688 between the same periods. This is not a sign of market weakness. The prior 12-month period included three closings above $525,000 (with two exceeding $600,000), a concentration of luxury-tier activity that inflated the average. The most recent period's top sale was $535,000. As the luxury tier normalized, the average came down even while the typical home gained value. Sales volume held steady at 16 closed transactions per 12-month period.
What types of homes are available in Lauren's Bay Topeka?
Ranch-style homes dominate Lauren's Bay, accounting for 25 of the 29 standard MLS sales in the analysis period (86%). Ranch homes sold across a wide price band, from $285,000 to $675,000, depending on the year built, lot size, finished basement square footage, and renovation level. The neighborhood also produced two 1.5-story sales, one split-level, and one earth contact home, though these styles represent a small minority of the available inventory.
Home sizes ranged broadly as well. Many of the older ranch homes have above-grade finished areas in the 1,250 to 1,750 square foot range but add substantial value through finished basements. Newer builds and larger homes push above-grade square footage to 2,000+ square feet. This diversity of size and era is part of what creates Lauren's Bay's wide price range and broad buyer appeal.
Do homes in Lauren's Bay sell for asking price?
On average, Lauren's Bay homes sold for 99.03% of their final asking price, meaning the typical seller accepted roughly $0.99 on every dollar asked. When measured against original list prices (before any reductions), the ratio drops to 97.27%, reflecting the 31% of homes that underwent price reductions before going under contract.
Homes that were priced right from the start frequently received offers at or above asking, particularly those that went under contract within the first two weeks. The homes that required price reductions averaged a 5.9% cut from the original list, suggesting that sellers who overshoot by more than roughly 6% tend to chase the market downward. Pricing correctly the first time is the strongest strategic advantage a seller has in this neighborhood.
Are sellers in Lauren's Bay offering closing cost assistance?
Seller concessions in Lauren's Bay remain relatively uncommon. Only 6 of 29 sellers (20.7%) offered any seller participation in closing costs, and among those who did, the average amount was $3,208. The maximum concession in the entire two-year period was $6,000.
This is a meaningful signal for buyers: the majority of Lauren's Bay sellers are not in a position where they feel they need to sweeten deals with cash-back concessions. That said, the 20.7% who did offer concessions were generally on homes in the entry to mid-tier price range, suggesting there may be some leverage for buyers in that segment, particularly with homes that have been sitting on market for more than 30 days.
What is the price per square foot in Lauren's Bay?
Lauren's Bay homes averaged $233.56 per square foot of above-grade finished area over the past two years. When total finished square footage (including finished basement area) is included, the figure drops to an average of $152.76 per square foot, which reflects the significant finished basement square footage common in this neighborhood's older ranch stock.
The distinction matters for buyers comparing Lauren's Bay to newer construction where finished basement space may be minimal or absent. A 2,000-square-foot ranch with a fully finished 1,500-square-foot basement offers considerably more functional living space per dollar than an above-grade-only comparison would suggest. Buyers should factor total finished square footage into any per-foot analysis.
Is Lauren's Bay Topeka a good real estate investment?
Lauren's Bay offers a compelling investment case for buyers focused on long-term value stability. The median price has appreciated 3.70% year over year, outpacing general inflation while remaining in sustainable territory. The 9-day median days on market and near-100% list-to-sale ratio confirm consistent buyer demand, which is the fundamental driver of healthy appreciation.
The neighborhood's wide price range ($285,000 to $675,000) creates entry points for both budget-conscious investors and buyers seeking move-up or luxury value. Homes in the $285,000 to $350,000 segment offer the most price competition relative to replacement cost for ranch homes built in the late 1950s through 1970s, while newer builds on the north end of the price range tend to command premium pricing that reflects modern finishes and larger above-grade square footage. For owner-occupant buyers in Topeka, Lauren's Bay combines strong schools, an established neighborhood feel, and rising values.
How does Lauren's Bay compare to other southwest Topeka neighborhoods?
Lauren's Bay sits in the upper-mid tier of southwest Topeka's residential market, with a median price of $390,000 that places it above many established west-side neighborhoods. Compared to neighborhoods like Westport and Cherry Creek, Lauren's Bay tends to offer larger lot sizes and more architectural diversity, though its price range and velocity are broadly comparable to those southwest Topeka submarkets. Neighborhoods like Hidden Valley and Colly Creek can offer more affordable entry points for buyers whose budget doesn't stretch to $390,000.
The key differentiators for Lauren's Bay are its combination of Washburn Rural school access, SW Wanamaker corridor convenience, and genuine inventory variety across price points from the $280s to the high $600s. Buyers who want the walkable feel of an established neighborhood with newer construction options available within the same community will find Lauren's Bay a strong contender in any southwest Topeka comparison.
What should buyers know before making an offer in Lauren's Bay?
The most important thing buyers need to know is that well-priced Lauren's Bay homes move quickly. With 44.8% of homes selling in 7 days or fewer and a 99% list-to-sale ratio, buyers who wait for price reductions on a good property are likely to lose it to someone more decisive. Getting pre-approved and having your agent pull comps the day a listing hits are table stakes in this neighborhood.
That said, buyers do have some leverage on homes that have been on market beyond 30 days. The 31% of homes that needed price reductions averaged a 5.9% cut before closing, suggesting sellers on extended listings are often willing to negotiate more than their current asking price implies. Focused buyers should monitor days-on-market closely and move quickly on freshly priced opportunities while using time strategically on longer-listed homes. Seller concession requests were accepted by about 1 in 5 sellers, so it is reasonable to include modest concession asks in offers on homes with extended market times.
Lauren's Bay Market Overview
Over the past two years, Lauren's Bay generated 32 closed transactions, including 3 off-market sales. The 29 standard MLS sales tell the primary market story: an average sold price of $413,631, a median of $390,000, and a price range extending from $285,000 to $675,000. This broad spread reflects Lauren's Bay's genuine diversity, from well-maintained older ranches to newer and substantially updated properties that command the upper end of the market.
Market velocity remains competitive. The median days on market across all 29 standard sales was 9 days, and nearly two-thirds of homes sold within two weeks. The average days on market of 26.5 days is pulled upward by a handful of outliers: two properties spent more than 100 days on market, both arriving at closing only after meaningful price reductions from original asks. Remove those two homes from the equation and the neighborhood average drops dramatically, underscoring how differently the market treats accurately priced homes versus overpriced ones.
Sellers in Lauren's Bay maintained strong pricing discipline. The average list-to-sale ratio was 99.03% against final asking price, and only 6 of 29 sellers (20.7%) provided any closing cost assistance. The neighborhood skews modestly toward sellers in the current environment, though the data also shows signs of normalization: days on market have increased from the prior 12-month period, and price reductions were a factor in nearly a third of transactions. The best characterization of Lauren's Bay today is a moderating seller's market where preparation and accurate pricing remain the decisive variables for both sides of a transaction.
Deeper Dive: Lauren's Bay Market Analysis
Days on Market: What the Numbers Actually Tell You
The median and average days on market in Lauren's Bay tell two different stories, and both matter. The median of 9 days is the more useful number for most buyers and sellers: it reflects the typical transaction, where a well-positioned home receives strong early interest and goes under contract within the first week or so. The average of 26.5 days is pulled higher by two outliers: 6017 SW 44th St (156 days, sold at $325,000 after starting at $370,000) and 4420 SW Lincolnshire Rd (113 days, sold at $675,000 after starting at $764,000). Both homes closed after significant price reductions, which explains the extended timelines.
For sellers, the takeaway is straightforward: homes that hit the market at a defensible price tend to generate activity immediately. Over 44% of Lauren's Bay homes sold in the first week alone. For buyers, extended days on market is a signal worth monitoring. Any home that's been sitting for 30 days or more has likely already signaled to the seller that a price correction may be needed, and that creates negotiating space that doesn't exist on new listings.
Year-Over-Year Snapshot: July 2024–July 2025 vs. July 2025–July 2026
Comparing the two 12-month periods in this analysis reveals a market that has appreciated at the median while normalizing at the average, and that has moderated in pace while holding steady in volume.
| Metric | July 2024 – July 2025 | July 2025 – July 2026 | Change |
|---|---|---|---|
| Median Price | $379,950 | $394,000 | +3.70% (+$14,050) |
| Average Price | $415,081 | $395,688 | -4.67% (-$19,393) |
| Closed Sales | 16 | 16 | Flat (0.0%) |
| Median DOM | 4 days | 12 days | +8 days |
| Average DOM | 15.6 days | 32.4 days | +16.8 days |
The median and average price moved in opposite directions year over year, which requires some explanation. The prior period (July 2024–July 2025) included three closings at $525,000, $640,000, and $675,000. That cluster of high-dollar transactions inflated the Year 1 average significantly. The most recent period's top sale was $535,000. The luxury tier simply wasn't as active. Meanwhile, the typical Lauren's Bay home (measured by the median) gained $14,050 in value, or 3.70%. The average is telling you about luxury segment activity; the median is telling you about the market.
The increase in days on market is the more important directional signal. The median jumped from 4 days to 12 days between periods, and the average more than doubled. This is not a distress signal; it is a normalization. Lauren's Bay in 2024 was moving at a pace more associated with a very hot market. The 2025–2026 period reflects a more measured environment where buyers have slightly more time to evaluate but still need to act decisively on quality listings.
Pricing Trends and Reduction Patterns
The list-to-sale ratio of 99.03% against final asking price suggests sellers are largely receiving what they ask. But the path to that outcome varies. 31% of homes (9 of 29) required a price reduction before closing, with an average reduction of $26,111, or about 5.9% below original asking. When measured against original list prices rather than final asking prices, the overall sold-to-list ratio drops to 97.27%.
This pattern is common in a market transitioning from very fast to moderately fast. Sellers who listed at aggressive prices in late 2024 or early 2025 sometimes found buyers needed more justification for premium asks. The homes that required corrections tended to be those priced at or above $400,000 on the basis of hoped-for value rather than comparable support. Going forward, sellers in Lauren's Bay who want to capture that quick, full-price close should price tightly to the data rather than testing the market with inflated initial asks.
Seller Concessions: A Modest Presence
Only 6 of 29 sellers (20.7%) provided any seller participation in closing costs over the analysis period. Among those who did, the average concession was $3,208, with the largest concession in the dataset being $6,000. All six concessions were on homes priced below $400,000, concentrated in the entry to mid-tier segment.
The takeaway for buyers: concessions are not expected or standard in Lauren's Bay, and asking for them on a competitively priced new listing is likely to be met with rejection or a counteroffer that reduces the purchase price instead of adding seller help. Buyers who genuinely need seller help for closing costs should focus on homes with extended days on market, where the seller has already demonstrated flexibility through price reductions and is more likely to entertain additional concession requests.
Lauren's Bay Home Style Comparison
Ranch homes define Lauren's Bay, representing 86% of all standard MLS sales. The remaining styles each have one to two data points, so their figures are directional rather than statistically representative. Use the Ranch row as the primary benchmark when evaluating specific properties.
| Style | Homes Sold | Avg. Price | Median Price | Avg. DOM | List-to-Sale |
|---|---|---|---|---|---|
| Ranch | 25 | $418,336 | $399,000 | 27.8 days | 99% |
| 1.5 Story | 2 (limited data) | $437,500 | $437,500 | 26.5 days | 99% |
| Split | 1 (single data point) | $369,900 | $369,900 | 4 days | 100% |
| Earth Contact/Sheltered | 1 (single data point) | $292,000 | $292,000 | 17 days | 101% |
Ranch homes are the market in Lauren's Bay. With 25 sales, they provide the only statistically meaningful dataset, and that dataset is highly variable: the ranch category spans $285,000 to $675,000, a spread of $390,000 within a single style. This reflects not just size differences but also age (1958 to 2022 construction), lot size variations ranging from under a quarter acre to over an acre, and the significant impact of basement finishing and renovation on value. Ranch median DOM of 9 days confirms strong buyer demand for the style across the price spectrum.
1.5-story homes averaged approximately 4.6% more than the ranch average ($437,500 vs. $418,336) in this two-year period, which likely reflects the above-average square footage these two examples offered (2,231 and 2,519 above-grade square feet respectively). With only two sales, these figures represent two specific homes rather than a style-level trend.
The split-level and earth contact sales are single transactions and should not be used as pricing benchmarks for other homes. The split at $369,900 sold in 4 days at full price, suggesting the right buyer existed for it; the earth contact at $292,000 sold slightly above asking (101% list-to-sale), which is an interesting outlier that likely reflects strong motivation on the buyer's side or a perceived value at the asking price.
Comparative observations: 1.5-story homes priced approximately $19,164 more on average than ranch homes in Lauren's Bay, while the split-level came in approximately $48,436 below the ranch average and the earth contact home approximately $126,336 below. These are reflective of specific transactions rather than durable style premiums or discounts, given the small sample sizes for non-ranch styles.
What Lauren's Bay Market Conditions Mean for You
If You're Selling in Lauren's Bay
The data gives sellers a clear roadmap. Homes priced within 3% to 5% of well-supported comparables generate quick, competitive offers: 44.8% of the neighborhood's sales closed in 7 days or fewer. Your list price is your most important marketing decision. Setting it 10% above the market to "leave room to negotiate" is a strategy that correlates directly with the 31% of Lauren's Bay homes that needed price reductions and the two outliers that sat for 100-plus days.
On preparation: buyers at $390,000 and above have choices and they show up with expectations. Condition matters. A home that shows clean, updated, and well-maintained captures that 99% list-to-sale ratio; a home that needs obvious work invites aggressive offers. The 79% of sellers who received no concession requests generally had well-prepared properties with realistic pricing.
Concession requests are a factor in roughly 1 in 5 transactions, so sellers should expect and be prepared for modest closing cost asks, particularly in the entry and mid-tier ranges. Building some pricing flexibility into your strategy is smarter than viewing every ask as an adversarial move.
If You're Buying in Lauren's Bay
Speed matters. With nearly half of Lauren's Bay homes selling in the first week and a 99% list-to-sale ratio across the neighborhood, competitive offers need to be written fast and written well. That means pre-approval in hand before you start touring, a clear sense of your upper budget, and a team that can move same-day when you find the right home.
Your negotiating leverage exists primarily on two categories of homes: those that have been on market for more than 30 days (where the seller has already received market feedback) and those in the entry-level price band below $325,000 where seller concession rates were higher. The 31% price reduction rate is worth tracking: if a home you're watching has already dropped once, that's a meaningful signal about the seller's flexibility.
Don't assume concessions. The majority of sellers in Lauren's Bay did not provide closing cost assistance, and asking for it on a fresh listing you're competing for could cost you the home. If financial assistance matters to your transaction, focus on homes with extended days on market where you have more leverage, or structure your offer price to reflect the net cost you need rather than asking the seller to cover closing costs separately.
Looking Ahead
The fundamentals supporting Lauren's Bay home values are intact. Consistent buyer demand, a 3.7% median price gain year over year, and no indication of significant distressed selling activity all point toward continued value stability. The moderating pace of sales (median DOM increasing from 4 to 12 days) is a healthy sign: markets that sustain value long-term tend to do so at measured paces, not frenetic ones.
The neighborhood's price ceiling is still being defined. Two sales above $600,000 in the first year of the analysis period demonstrate that top-tier buyers exist in Lauren's Bay, even if that tier was quieter in the most recent 12 months. New construction activity visible in the active listings suggests continued investment in the neighborhood's upper price band. For buyers who get in at today's mid-tier prices, the long-run trajectory for Lauren's Bay looks favorable.
Ready to Make Your Move in Lauren's Bay?
Whether you're thinking about selling, actively searching for your next home, or just trying to understand what your Lauren's Bay property is worth in today's market, Team Ringgold can help. We live and work in this market every day, and we use real data, not guesswork, to advise our clients.
Sellers: Find out what your Lauren's Bay home is worth in the current market with a no-obligation comparative market analysis. We'll show you where your home fits in the data and help you build a pricing and presentation strategy designed to capture that 99% list-to-sale ratio.
Buyers: If Lauren's Bay is on your radar, you need someone who can help you move fast when the right home hits. We'll set you up with alerts and walk you through what to expect in offers before you're under the gun.
Just exploring: No pressure. Real estate decisions are big ones, and we're happy to talk through what the data means for your specific situation without any agenda. Reach out anytime at searchtopekahomes.com or give us a call.
Structured Data Summary: Lauren's Bay Real Estate Market
NEIGHBORHOOD: Lauren's Bay
CITY / STATE: Topeka, Kansas
ANALYSIS PERIOD: July 2024 – July 2026 (24 months)
YEAR 1 WINDOW: July 2024 – July 2025
YEAR 2 WINDOW: July 2025 – July 2026
TOTAL CLOSED TRANSACTIONS: 32 (29 standard MLS + 3 Sold Before Process MLS)
SALES USED FOR PRICE METRICS: 29 standard MLS closed sales
AVERAGE SOLD PRICE: $413,631
MEDIAN SOLD PRICE: $390,000
PRICE RANGE: $285,000 – $675,000
AVG. PRICE / ABOVE-GRADE SF: $233.56
AVG. PRICE / TOTAL FINISHED SF: $152.76
AVERAGE DAYS ON MARKET: 26.5 days
MEDIAN DAYS ON MARKET: 9 days
SOLD IN 7 DAYS OR FEWER: 44.8% (13 of 29)
SOLD IN 14 DAYS OR FEWER: 62.1% (18 of 29)
LIST-TO-SALE RATIO (VS. FINAL ASK): 99.03%
LIST-TO-SALE RATIO (VS. ORIGINAL LIST): 97.27%
HOMES WITH PRICE REDUCTIONS: 31.0% (9 of 29), avg. reduction $26,111 (5.9%)
SELLERS OFFERING CONCESSIONS: 20.7% (6 of 29)
AVG. CONCESSION (THOSE WHO PAID): $3,208
MAX CONCESSION IN PERIOD: $6,000
YoY MEDIAN PRICE (JUL 2024–JUL 2025): $379,950 (16 sales)
YoY MEDIAN PRICE (JUL 2025–JUL 2026): $394,000 (16 sales)
YoY MEDIAN CHANGE: +3.70% (+$14,050)
YoY AVG. PRICE (JUL 2024–JUL 2025): $415,081
YoY AVG. PRICE (JUL 2025–JUL 2026): $395,688
YoY AVG. CHANGE: -4.67% (-$19,393) — reflects luxury tier mix shift, not market decline
YoY VOLUME CHANGE: Flat (16 vs. 16 total closed)
YoY MEDIAN DOM (JUL 2024–JUL 2025): 4 days
YoY MEDIAN DOM (JUL 2025–JUL 2026): 12 days
STYLE DISTRIBUTION:
Ranch: 25 sales (86.2%), avg. $418,336, median $399,000
1.5 Story: 2 sales (6.9%), avg. $437,500 (limited data)
Split: 1 sale (3.4%), $369,900 (single data point)
Earth Contact/Sheltered: 1 sale (3.4%), $292,000 (single data point)
OFF-MARKET TRANSACTIONS (SBP MLS): 3 — $185,000 (Aug 2024), $367,000 (Jun 2025), $425,000 (Oct 2024); excluded from price metrics
PUBLISHED BY: Team Ringgold, Keller Williams One Legacy Partners, Topeka KS
WEBSITE: searchtopekahomes.com
MARKET CHARACTERIZATION: Moderating Seller's Market
